XRP Encountered a Strong Resistance
Explore the current XRP market conditions and potential scenarios with a detailed technical analysis. Learn about key resistance levels, support areas, and the outlook for strategic trading decisions.
12/14/20231 min read
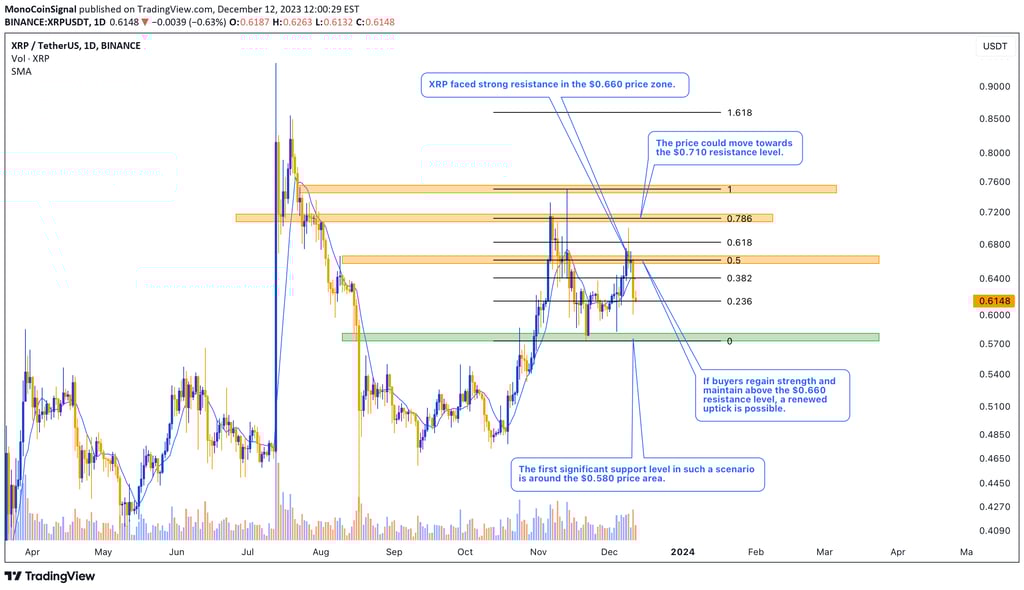

Following a significant surge, XRP encountered a strong resistance in the $0.660 price zone. At this juncture, sellers entered the market, leading to the loss of momentum by buyers (supporters of the upward trend). This development initiated a major downward trend, with the price falling below the $0.6150 support level.
Should the buyers manage to regain their strength and sustain above the $0.660 resistance level, there is a potential for a renewed uptick, moving the price towards the next resistance level at $0.710. The continuation of this upward trajectory could lead the price towards a higher resistance level of $0.750.
However, if XRP fails to breach the $0.625 resistance level, it could indicate the beginning of a new downward trend. In this scenario, the first significant support level lies in the $0.580 price area, where a breach could potentially lead to further declines in price as sellers gain control.