XAU Technical AnalysisYour blog post
Gold has broken its mid-term downtrend line, reaching around $2062 at the Fibonacci 0 line. The upward trend is expected to persist with potential higher targets, though a pullback to lower support levels may precede. First significant support at $2038, while a breach of $2062 could propel gold towards the next resistance area around $2085.
1/15/20241 min read
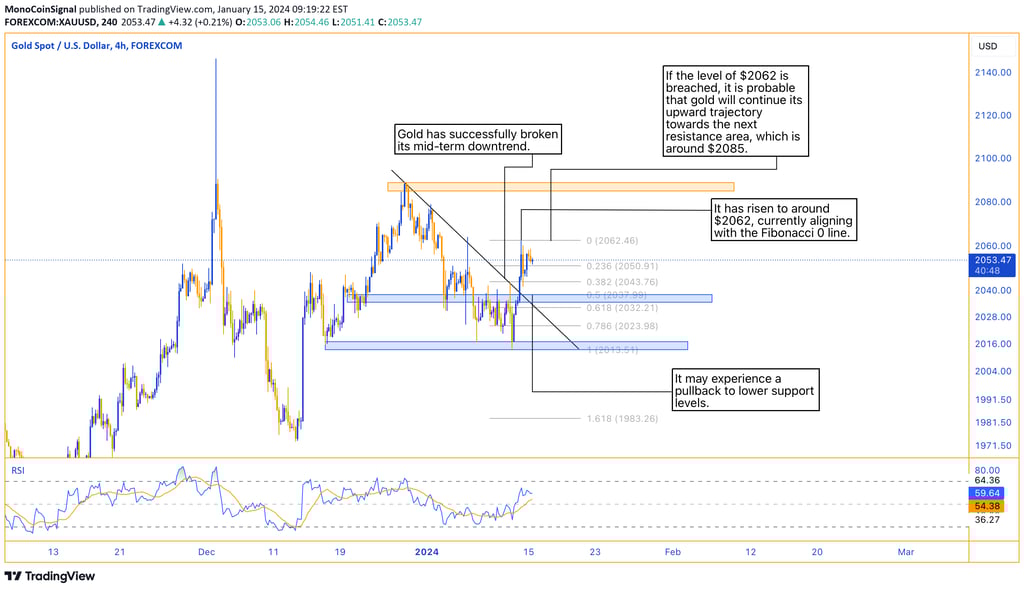
• Gold has successfully broken its mid-term downtrend line and has risen to around $2062, which is currently at the Fibonacci 0 line.
• The upward trend in gold is likely to persist and it might achieve higher targets. However, it may experience a pullback to lower support levels before continuing its ascent.
• The first significant support level for gold is at $2038.
• On the flip side, if the level of $2062 is breached, it is probable that gold will continue its upward trajectory towards the next resistance area, which is around $2085.