What to Expect Next
Upward trend observed on the daily chart with a critical resistance at $0.078. The RSI at 54 indicates a balanced market momentum. Potential price trajectories discussed based on resistance outcomes.
9/6/20231 min read
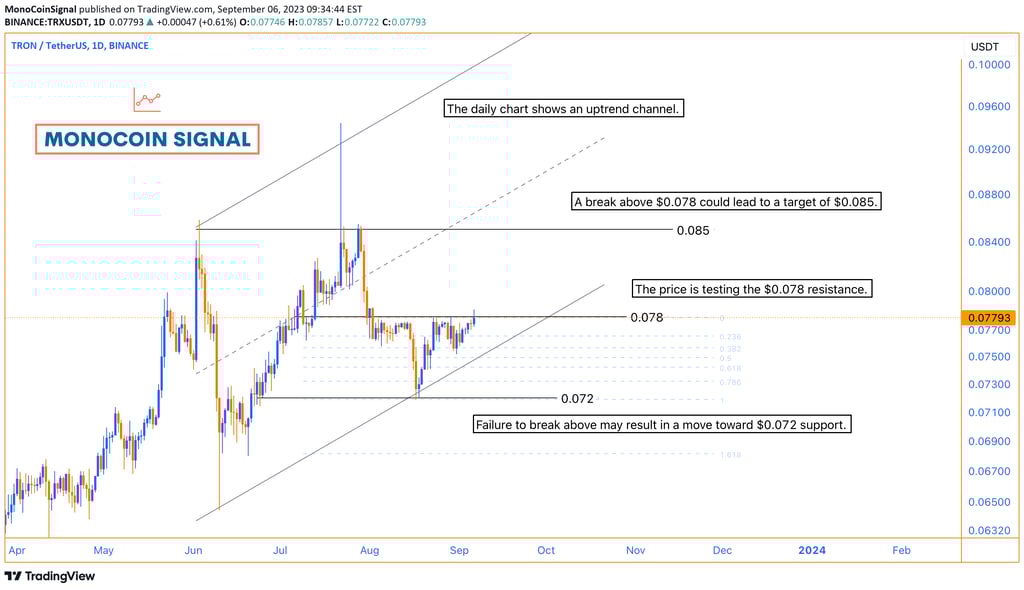
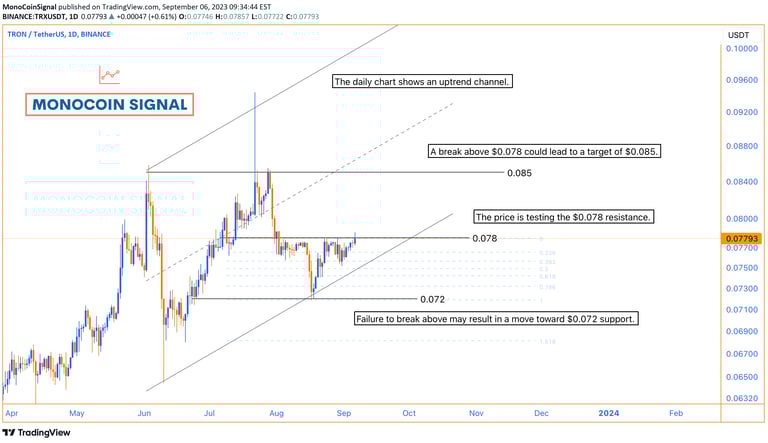
On the daily chart, there's an upward trend pattern. Right now, the price is testing a barrier at $0.078. If it manages to break through this level, we can expect the price to continue rising, possibly reaching $0.085. However, if the price can't surpass this resistance, we might see it drop down to around $0.072.
Additionally, the Relative Strength Index (RSI) currently stands at 54. This level indicates a moderately strong momentum in the market. It suggests that there is some bullish sentiment, but it's not too extreme. Traders are neither overwhelmingly buying nor selling at this point.