Watch for Potential Consolidation
Analyze BEL's price dynamics as it confronts a pivotal resistance near the upper Bollinger Band at 0.7671. The MACD remains bullish, but traders must stay attentive to potential momentum shifts. The lower Bollinger Band at 0.7220 serves as a key support zone, while monitoring volume trends is essential. Opportunities near the SMA at 0.7491 could emerge amid potential pullbacks.
2/27/20241 min read
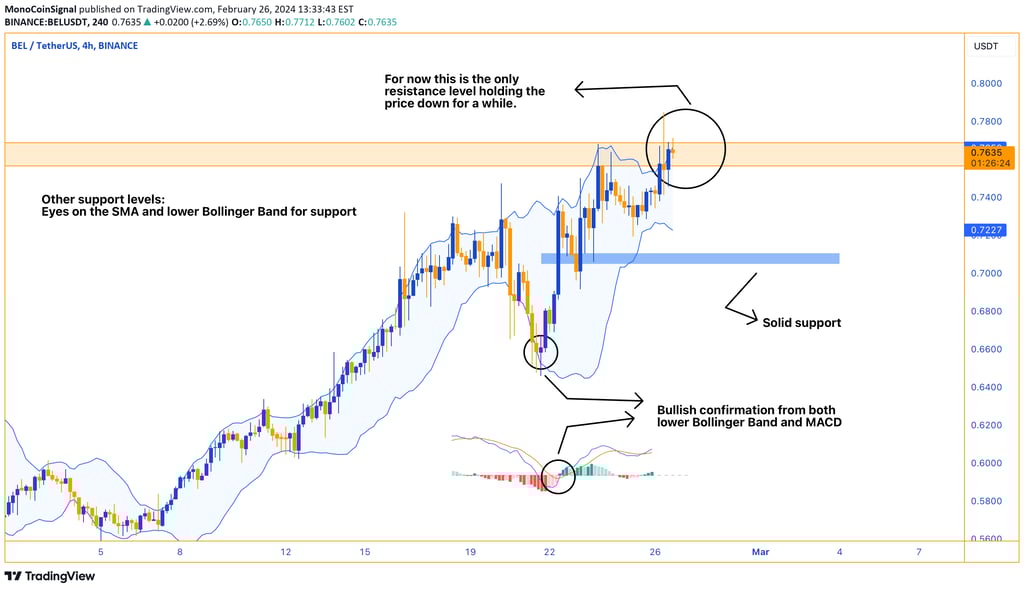
BEL's price movement is hitting a key resistance at the upper Bollinger Band, indicating a temporary ceiling at around 0.7671. The MACD signals continued bullish sentiment, yet traders should be vigilant for any shifts in momentum, with the lower Bollinger Band at 0.7220 poised to offer support. The volume trend will be crucial to watch, as a decrease may precede a pullback, offering opportunities near the SMA at 0.7491.