USDJPY: At Consolidation
Delve into the current dynamics of the USDJPY pair at 150.6, showcasing consolidation in the 4-hour chart. Analyze the contracted Bollinger Bands, the pivotal role of the Simple Moving Average (SMA), and indicators like RSI and MACD for potential market movements. With a positive MACD histogram and moderate bullish RSI, observe key levels and volume trends for potential breakouts or reversals.
2/22/20241 min read
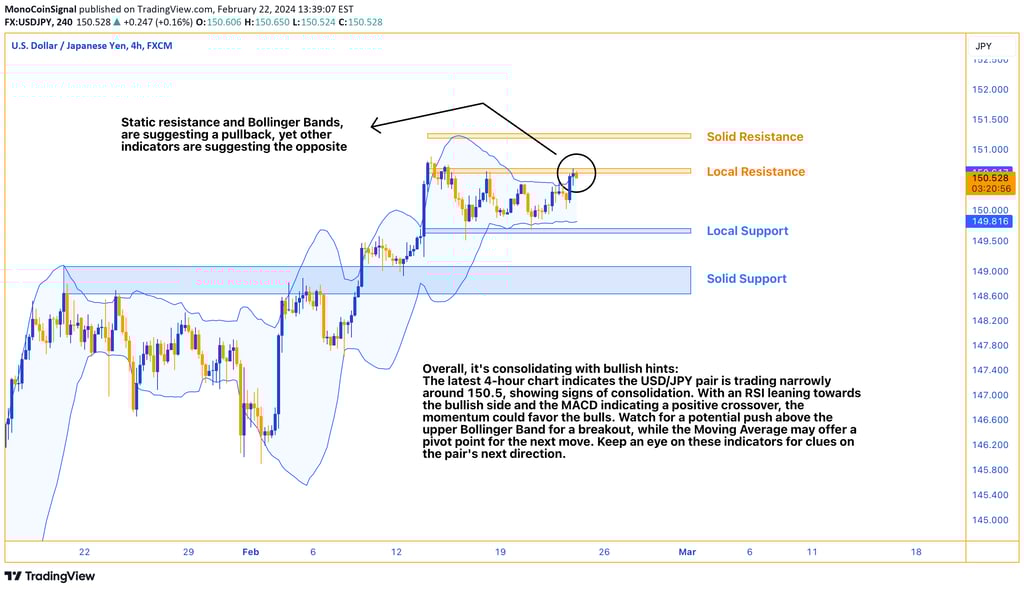
The USDJPY pair is currently holding at 150.6, showing signs of consolidation in the 4-hour chart. A tight trading range is evident, with the Bollinger Bands slightly contracting, suggesting a period of low volatility. The pair is trading just above the Simple Moving Average (SMA) at 150.354, which could act as a pivot point for future price movements.
From an oscillators perspective, the RSI is moderately bullish at 62.86, signaling that there could be more room for upside before the pair hits overbought territory. Additionally, the MACD histogram is positive, and the MACD line has crossed above the signal line, indicating increasing bullish momentum.
Volume stands at 6.807K, confirming a decent level of trading activity. However, traders will need to watch for a breakout from the current range for a clearer directional bias. A sustained move above the upper Bollinger Band at 150.631 could open the door for further bullish momentum, potentially targeting higher resistance levels. Conversely, a dip below the SMA and lower Bollinger Band at 149.809 may signal a bearish shift, with traders then looking for support targets below.