Up 666%: Momentum Continues Amid Recent Listings
Delve into an in-depth analysis of LOOM Network's impressive bullish trend, marked by a 509% surge. We explore technical indicators, chart patterns, and the impact of recent listing announcements to provide a comprehensive overview of LOOM's current market stance and potential future trajectory.
10/14/20231 min read
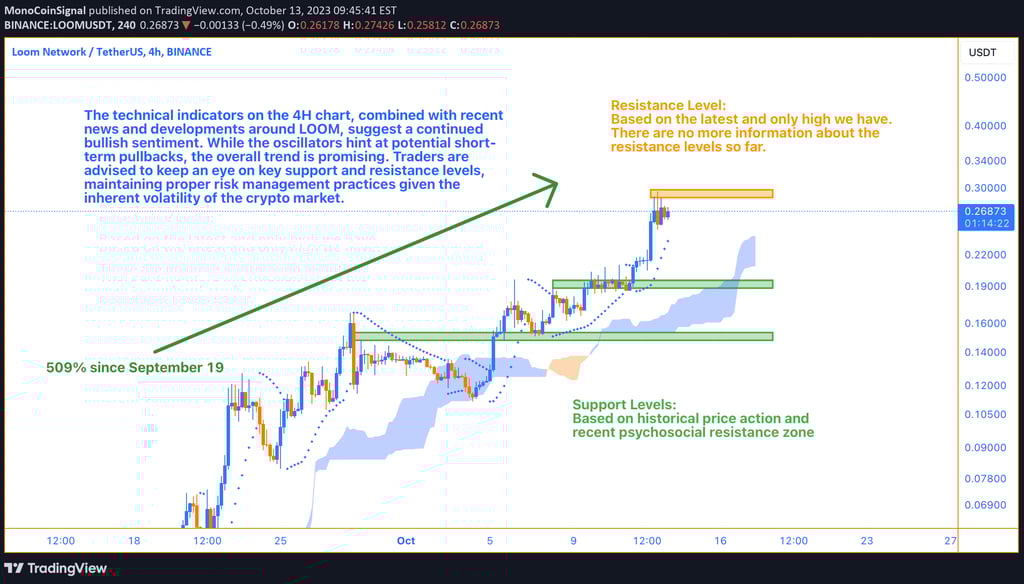
The LOOM Network has been the center of attention in recent trading sessions, showcasing a bullish uptrend that's been particularly pronounced since September 19. After an impressive 509% price surge, LOOM is now trading around $0.2727. The listing announcements on LBANK and Binance futures platforms have likely contributed to this bullish trend, increasing the coin's visibility and trading volume.
The image below shows a 666% change since September 1:
Technical Insights:
Fibonacci Retracement: Without diving into the exact numbers, the fib retracement levels suggest that we've recently surpassed significant resistance levels, pointing to a potential continuation of the upward trajectory if momentum remains.
Ichimoku Cloud: The price action remains above the Ichimoku cloud, signaling a continued bullish sentiment.
Parabolic SAR: Currently, the dots are below the price, suggesting that the bulls are in control. This typically acts as a support level, signaling a potential continuation of the upward trend.
Bollinger Bands: Price action remains near the upper Bollinger Band, indicating strong bullish momentum. Traders should, however, be cautious of potential volatility.
Volume Oscillator: A positive plot suggests that buying pressure is currently outweighing selling pressure, further confirming the bullish trend.
MACD: The MACD line remains above the signal line, reinforcing the current bullish sentiment.
RSI: Though hovering around the overbought region, the high RSI suggests strong buying momentum.
Oscillators & Moving Averages: Oscillators are leaning towards a "Sell" signal, suggesting potential short-term pullbacks or consolidation. In contrast, the moving averages highlight a "Strong Buy" scenario, implying that the overall trend remains bullish.
Conclusion:
The technical indicators on the 4H chart, combined with recent news and developments around LOOM, suggest a continued bullish sentiment. While the oscillators hint at potential short-term pullbacks, the overall trend is promising. Traders are advised to keep an eye on key support and resistance levels, maintaining proper risk management practices given the inherent volatility of the crypto market.