Under Pressure
The SHIB 4-hour chart indicates a market in search of direction, with the price trading below the simple moving average and indicators like the Stochastic Oscillator and RSI in neutral territory. Traders should watch key resistance and support levels for potential breakout or breakdown signals.
4/5/20241 min read
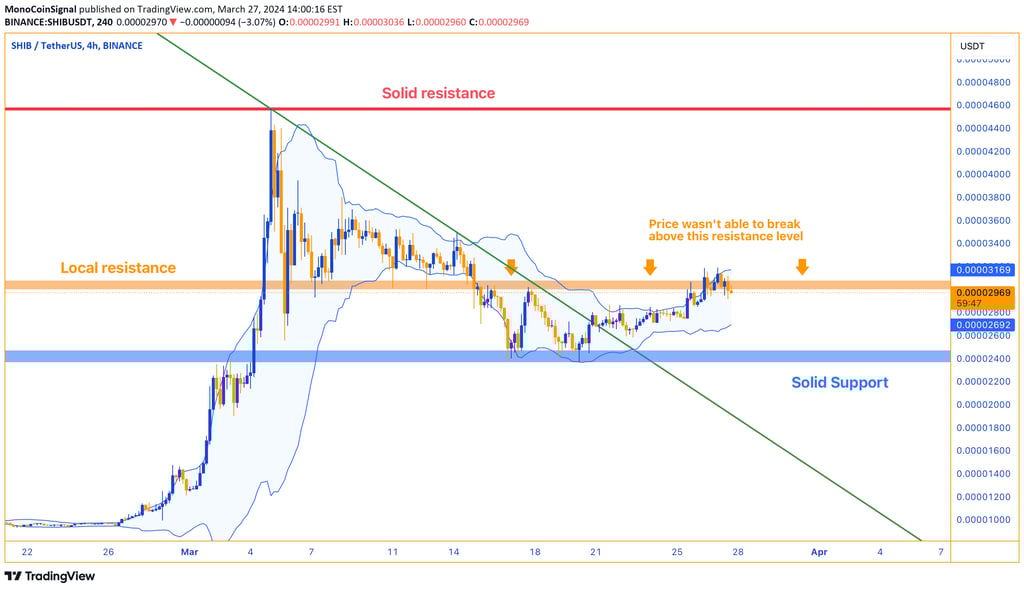
The SHIB 4-hour chart indicates that SHIB is in a phase of equilibrium, with the indicators collectively suggesting a market in search of direction. The price is trading just below the simple moving average (SMA), which typically suggests a balance between buyers and sellers, but also signals that the bulls have not yet gained full control to push the price upward with conviction.
The proximity of the price to the upper Bollinger Band, while not touching it, implies that there is some buying pressure, but not enough to break the solid resistance. The volume is quite substantial, which sometimes can precede a significant move, but for now, it hasn't translated into a breakout, which is what traders might be watching for.
The Stochastic Oscillator and the Relative Strength Index (RSI) are both in neutral territory. This alignment shows that while there has been recent buying and selling activity, neither side is dominating, leading to a consolidation pattern on the chart.
Given that the MACD line is at parity with the signal line, as indicated by the histogram at zero, there's no immediate momentum favoring either a bullish or bearish move. This, combined with the RSI and Stochastic Oscillator’s neutral readings, paints a picture of a market that is currently undecided.
Overall, SHIB is in a holding pattern, with the indicators waiting for a catalyst that could define the next clear move. The key levels to watch are the solid resistance above and the strong support below. A break above the resistance could signal a shift to a bullish sentiment, while a drop below the support could usher in bearish momentum. For now, the indicators suggest watchfulness and caution as SHIB navigates this zone of indecision.