Triangle's top
The overall trend of MINA is ranging with significant fluctuations within a triangle pattern. Currently positioned at the top of the triangle, the price might drop to the bottom before moving upwards to potentially break the triangle.
6/8/20241 min read
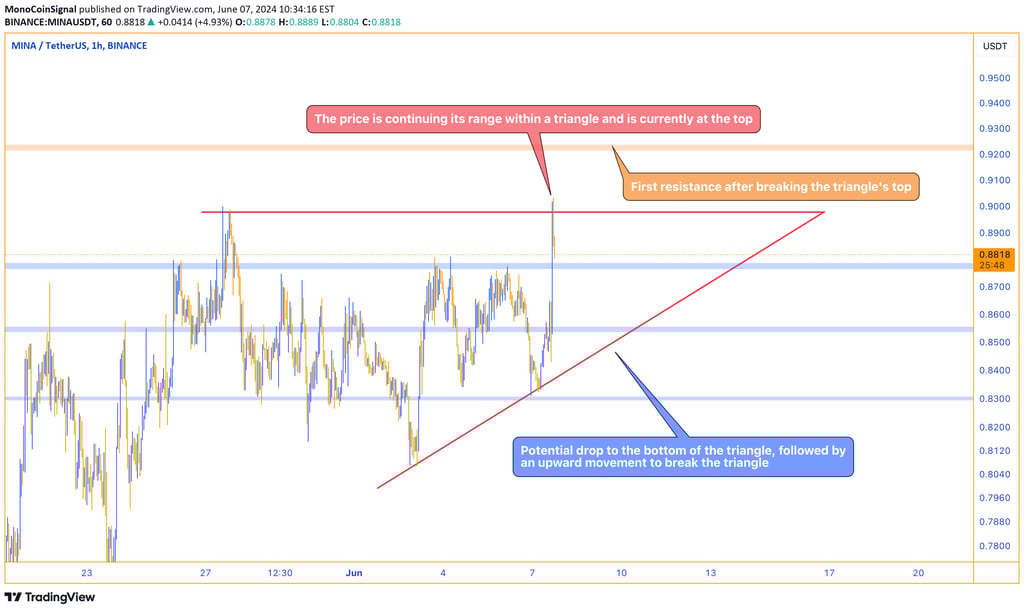
The overall trend of MINA is rang, and we are seeing good fluctuations. It has a triangle pattern, and the price is currently continuing its range within this triangle, now positioned at the triangle's top.
The price might drop to the bottom of the triangle, and from there, it can move upwards to break the triangle.