Triangle pattern nearing a break
SEI Analysis: Recent fakeout above triangle pattern followed by drop to support trendline. Resistance at $0.54. Critical decision point approaching as pattern nears breakout. Main support levels at $0.47 and $0.40.
6/10/20241 min read
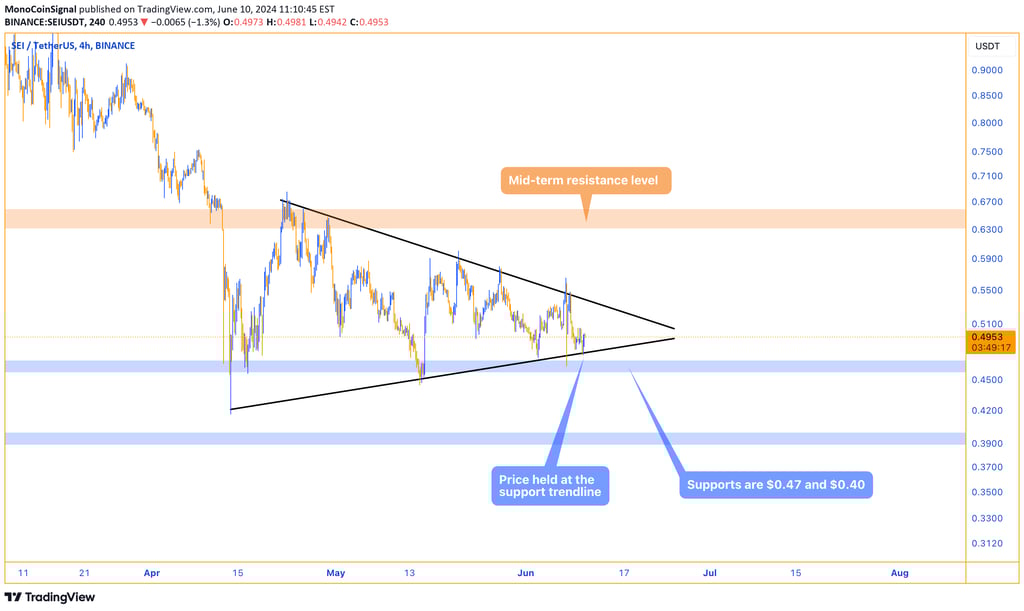
SEI experienced a fakeout above the triangle and then instantly dropped back down. The price managed to hold at the support trendline, maintaining the integrity of the pattern. The resistance level is currently at the $0.54 area. The triangle is now approaching a critical decision point, and it's essential to monitor which direction the pattern will break. The main support levels to watch are $0.47 and $0.40.