Triangle Pattern
ATOM price action is consolidating within a symmetrical triangle pattern, with a higher probability of an upward breakout given the prevailing uptrend. Key levels include the support zone at $3.20 and the crucial resistance zone at $4. Breaking above $4 could signal a continuation of the uptrend.
6/2/20241 min read
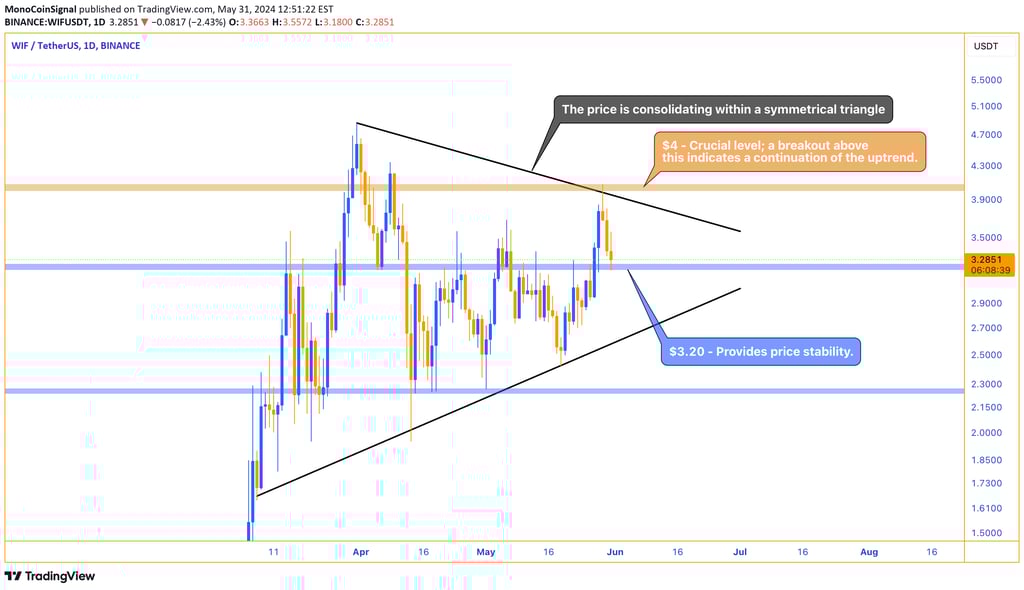
The price action is currently consolidating within a symmetrical triangle pattern. Given the prevailing uptrend, the probability of an upward breakout is higher. The support zone at the $3.20 area is identified as a significant level, providing stability to the price. Meanwhile, the resistance zone at $4 is crucial. A breakout above this resistance would indicate the continuation of the uptrend.