There is a possibility for the price to rebound upwards
On the daily timeframe, MAV is in a bearish trend with a sharp price decline. The price has broken its support level, which may now act as resistance. A return to this level could lead to an upward rebound if the breakdown proves to be false. Read our full analysis for detailed insights.
6/20/20241 min read
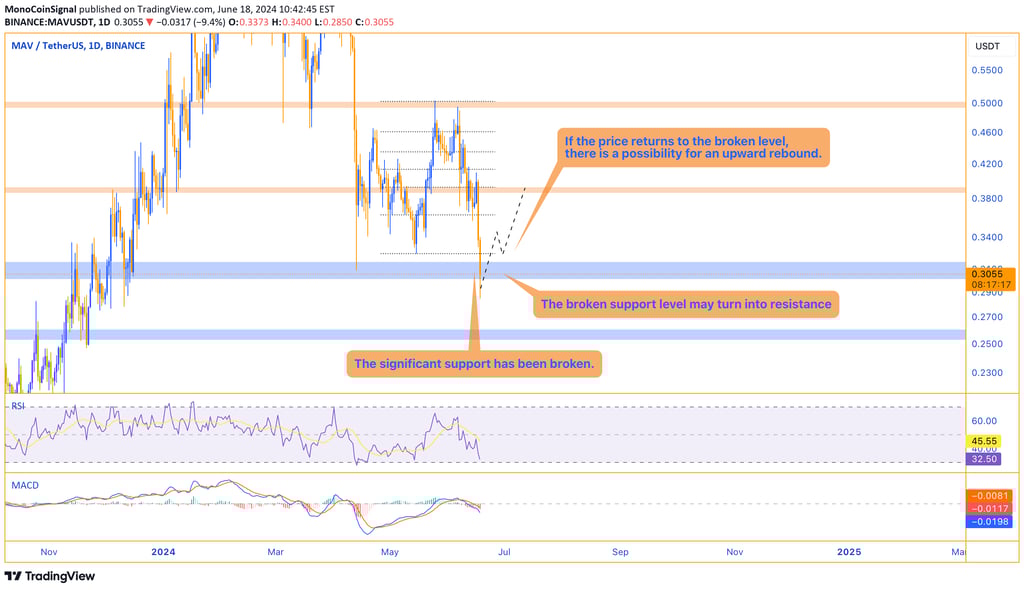
In the daily timeframe, the overall trend of MAV is bearish, and the price is sharply declining. As you can see on the chart, the price has broken its support level, which now has the potential to turn into resistance. If the price returns to the broken level and the breakdown proves to be false, there is a possibility for the price to rebound upwards.