The price is in a downtrend
STX is in a downtrend, currently testing short-term support. Watch for a break above the $0.029400 resistance to signal upward movement. Key support levels include $0.015950 and $0.011120.
6/9/20241 min read
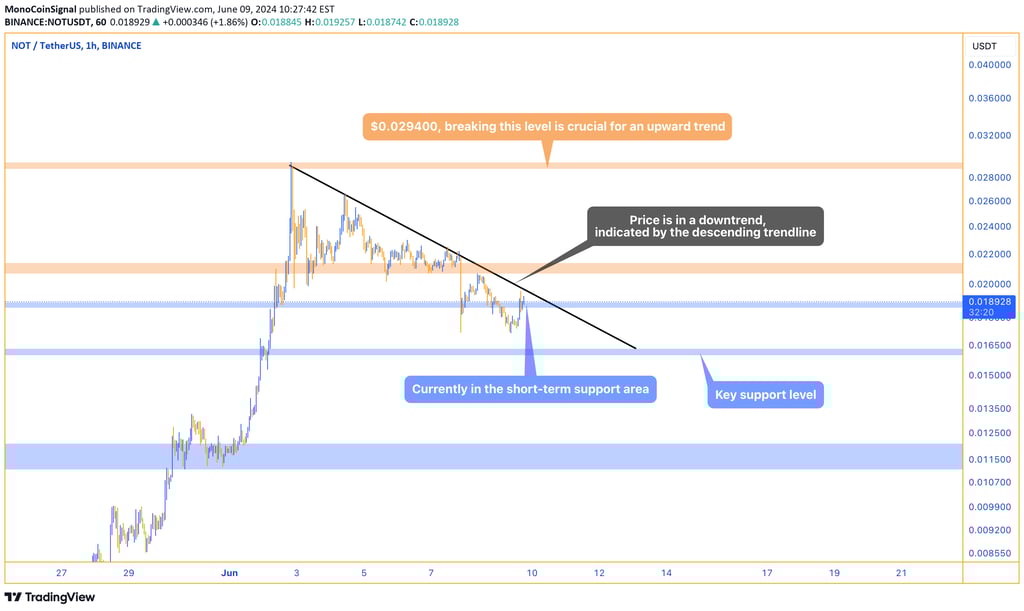
The price is in a downtrend, indicated by the descending trendline. Currently, the price is in the short-term support area and needs to break the descending trendline and the resistance level at $0.029400 to continue its upward movement. Increased trading volume at support points can indicate strong buying.
The key support level is at $0.015950, which has previously acted as support. The resistance level to watch is at $0.029400, and breaking this level is essential for continuing the upward trend.
For short-term traders, a break and consolidation above the descending trendline could lead to a new upward movement. Long-term traders should monitor lower support levels like $0.011120 and consider re-entering the market if higher support levels are broken.