The price could return to the 70k and 71k levels
Bitcoin surged past $70,000 but faced rejection, finding strong support between $67,000 and $65,800. This range could push BTC back to the $70,000-$71,000 resistance. Monitor the main ascending trend line at $65,800 for potential long positions during corrections. Note: This is an analysis, not a trading signal.
5/28/20241 min read
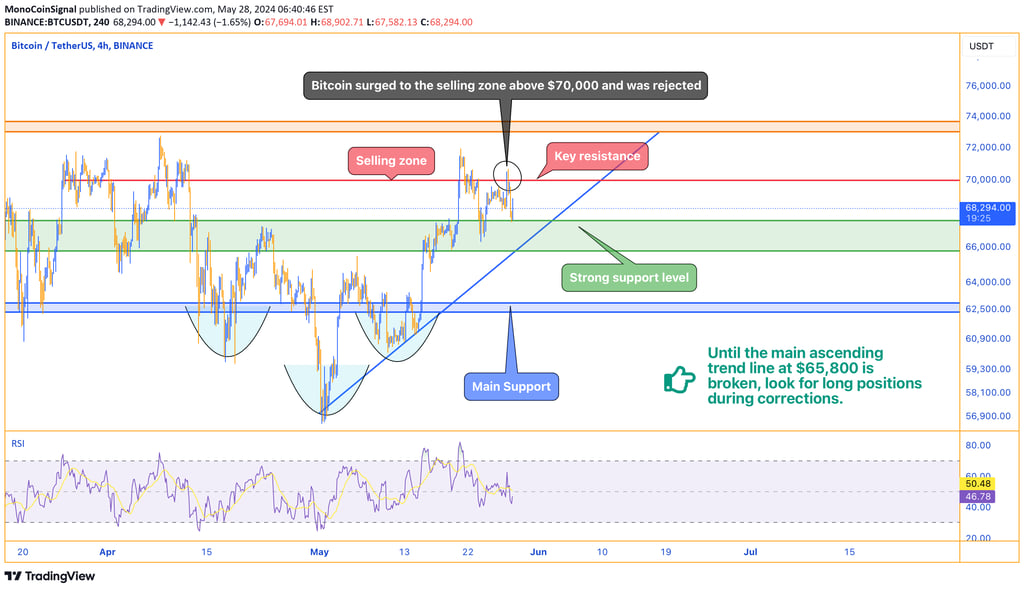
Bitcoin surged to the selling zone above $70,000 and was rejected again. Currently, it has strong support in the $67,000 to $65,800 range, which could potentially push it back towards the $70,000 to $71,000 resistance level.
Keep an eye on your watchlist, as long as the main ascending trend line at around $65,800 is not broken, you can look for long positions during corrections.
Please note that this is an analysis, not a trading signal.