Testing the upward trendline
Solana is testing its upward trendline on the daily timeframe. If it stabilizes above this line, the next resistance level could be targeted. Increased trading volume and confirmation of the breakout are key indicators for continued upward movement.
5/27/20241 min read

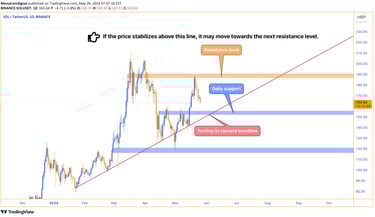
Solana is currently testing its upward trendline on the daily timeframe. If the price stabilizes above this line, it can be expected to move towards the next resistance level. It is noteworthy that confirmation of the upward trendline breakout and higher trading volume can serve as stronger indicators for continued upward movement.