Testing the upper boundary of the triangular pattern
Pepe2 is testing the upper boundary of its triangular pattern and facing resistance at 8400. Breaking and stabilizing above this level could trigger a strong upward movement. Failure to break through may lead to a retracement and continued consolidation within the pattern.
5/28/20241 min read
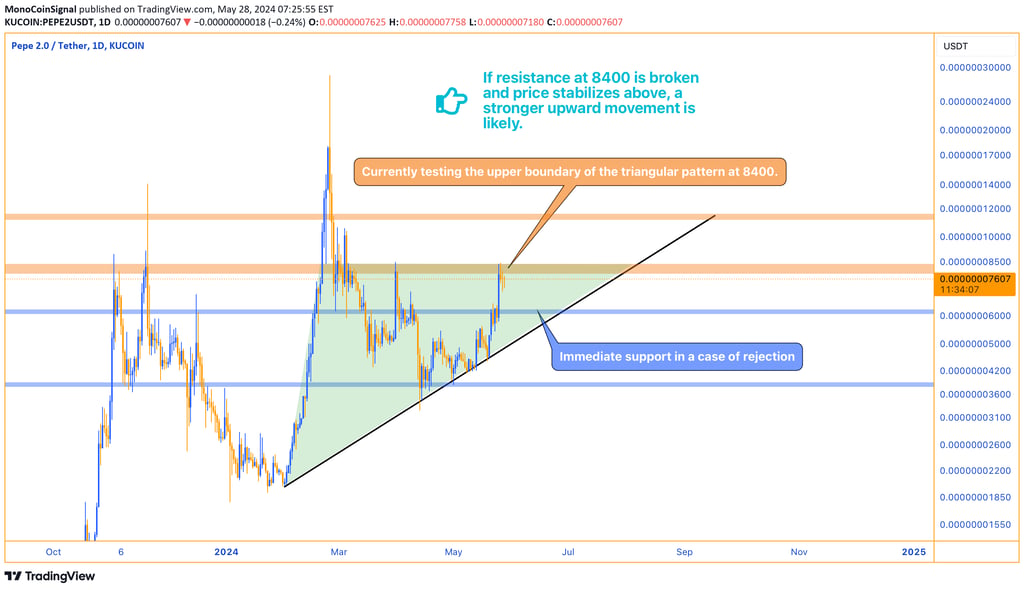

Pepe2 is currently testing the upper boundary of the triangular pattern and facing resistance at 8400. If this resistance is broken and the price stabilizes above it, we may witness a stronger upward movement. However, if it fails to break this resistance, we could see a price retracement to lower levels and continued movement within the triangular pattern.