Testing the bottom of the ascending triangle
BNB's daily chart shows the price testing the bottom of an ascending triangle at $580. Key resistance is at $632, a break of which could indicate an upward trend continuation. Conversely, breaking $580 support may lead to further price declines.
6/2/20241 min read
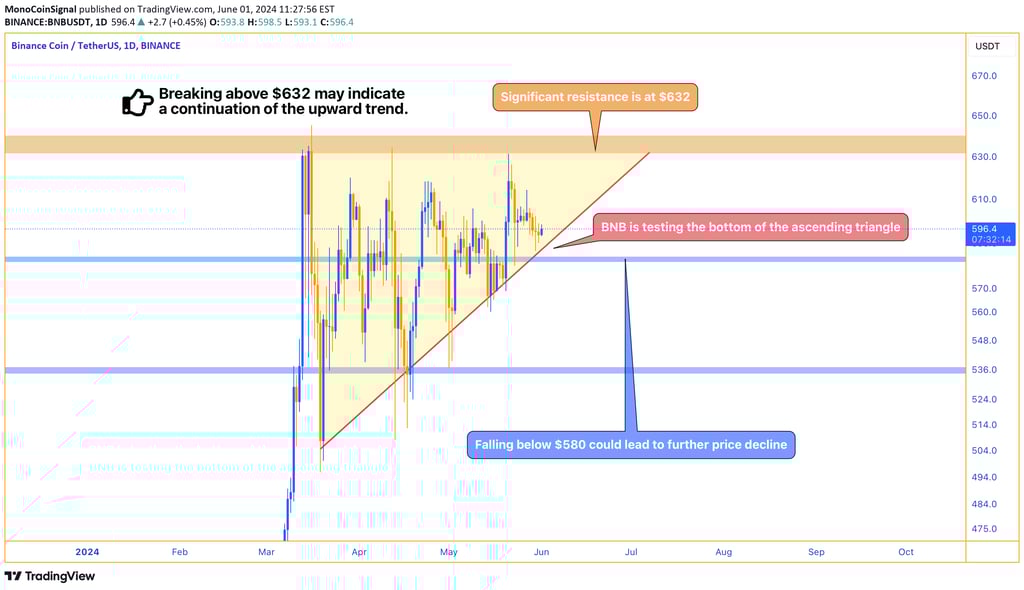

In the daily chart of BNB, it is observed that the price is testing the bottom of the ascending triangle formed at the price range of $580.
The significant resistance level is at $632, which, if broken, can be seen as an indication of the continuation of the upward trend. Breaking the support level at $580 could lead to a further decline in price to lower levels.