Supportive Role of Previous Resistance Zone
Analyzing a running flat pattern formation within an ascending trendline on a daily timeframe, highlighting potential price and time corrections and the significance of support-resistance dynamics for trend continuation.
4/14/20241 min read
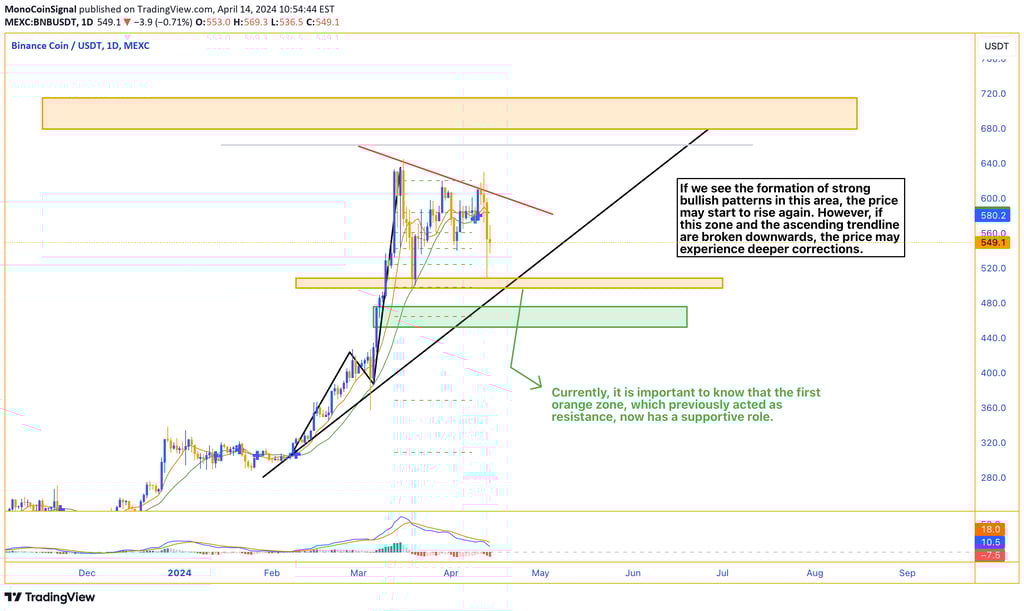
On a daily timeframe, we have drawn an ascending trendline and are witnessing the formation of an upward pattern known as a running flat.
After this pattern was formed, the currency experienced a significant increase and is currently undergoing price and time corrections.
Previously, we had mentioned the possibility of forming a triangle pattern, the upper side of which is marked with a red line. During its last rise, the price could not stabilize beyond this area and we are again seeing a price decline.
It is important to know that the first orange zone, which previously acted as resistance, now has a supportive role. If we see the formation of strong bullish patterns in this area, the price may start to rise again. However, if this zone and the ascending trendline are broken downwards, the price may experience deeper corrections.