Supply/Demand Zone
Bitcoin's strong bullish trend continues, challenging the upper supply zone at $42,640. Key support at the lower demand zone of $40,170 is critical. Monitoring price reactions in these zones provides insights into potential market shifts.
12/4/20231 min read

The current trend in the Bitcoin market is strongly bullish, characterized by a sustained upward trajectory in prices. This trend has led to the invalidation of a previous supply zone, signaling a continuation of the upward momentum.
Key levels:
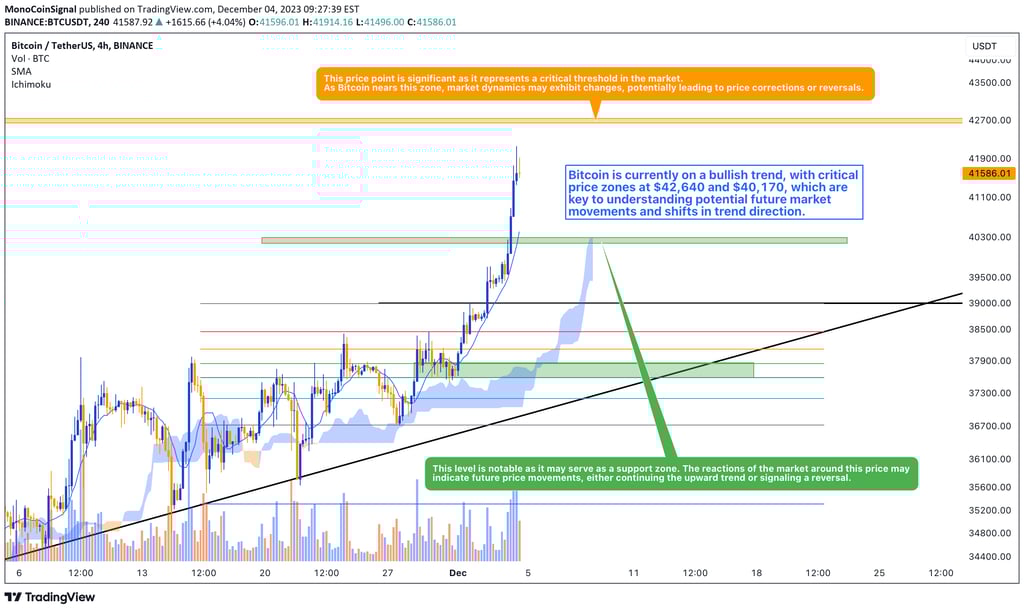
Upper Supply Zone at $42,640: This price point is significant as it represents a critical threshold in the market. As Bitcoin nears this zone, market dynamics may exhibit changes, potentially leading to price corrections or reversals.
Lower Demand Zone at $40,170: This level is notable as it may serve as a support zone. The reactions of the market around this price may indicate future price movements, either continuing the upward trend or signaling a reversal.
The market's approach to these zones is a focal point for observing potential shifts in Bitcoin's price movement. The upper supply zone around $42,640 is particularly crucial for monitoring any bearish reversals or continuations of the bullish trend. Meanwhile, the lower demand zone near $40,170 is key for identifying potential support levels and subsequent market reactions.
The current bullish trend in Bitcoin is marked by key zones at $42,640 and $40,170, which are pivotal in understanding the market's future direction. The interactions of the price with these zones could provide insights into the next phases of Bitcoin's market movement.