Spotting the Highs and Lows
Explore an in-depth analysis of STRAX's performance on the 1-hour chart, where a mix of bullish and bearish signals amidst consolidation follows a significant rally. Discover key technical indicators and Fibonacci levels that will play a pivotal role in unveiling STRAX’s next move.
10/16/20231 min read
STRAX on the 1-hour chart has shown signs of consolidation post a significant upward rally. The juxtaposition of various technical indicators suggests a mix of bullish and bearish cues, making it imperative to keep an eye on established levels.
Technical Indicators Overview:
Bollinger Bands: The price nearing the upper band often implies strong bullish momentum. However, it can also suggest a potential pullback or consolidation in the near term.
Parabolic SAR: Its position above the price could indicate potential short-term bearishness.
MACD: The closeness between the MACD and Signal lines suggests a lack of decisive momentum in the current phase.
RSI: Being in the neutral zone, it doesn’t hint at immediate overbuying or overselling.
Stochastic Oscillator: Its neutral positioning doesn't provide a definite buy or sell directive.
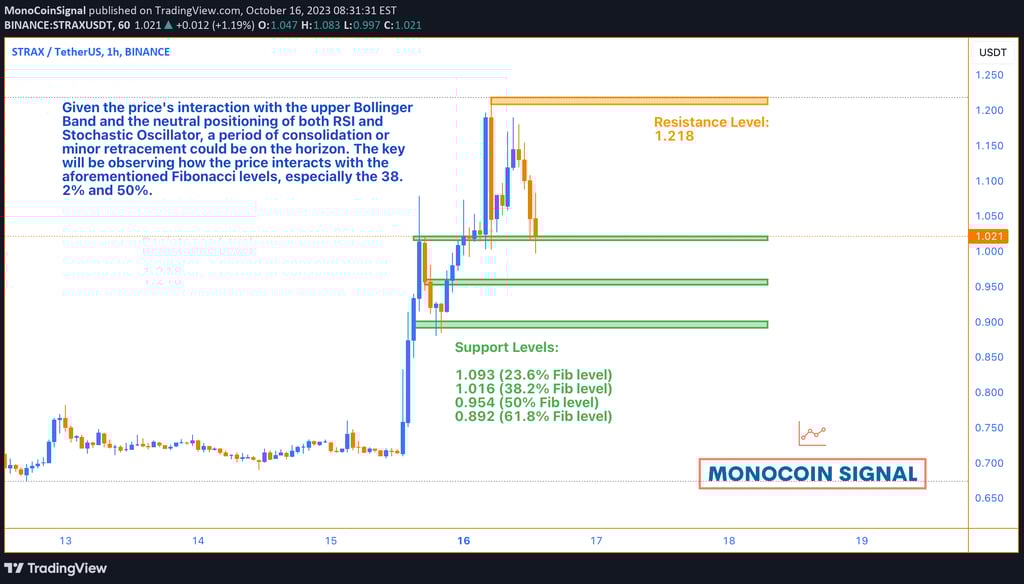
Fibonacci Retracement Levels:
The proximity to the 0% level indicates recent bullish strength.
The 38.2% and 50% levels will be pivotal in determining if the bullish trend will resume or if a deeper correction is in play.
Probable Scenario:
Given the price's interaction with the upper Bollinger Band and the neutral positioning of both RSI and Stochastic Oscillator, a period of consolidation or minor retracement could be on the horizon. The key will be observing how the price interacts with the aforementioned Fibonacci levels, especially the 38.2% and 50%.
Bullish or Bearish?
The current indicators suggest a cautious bullish stance. Still, vigilance is advised, especially around the crucial Fibonacci retracement levels.