SOL's $185 Standoff
Solana (SOL) is currently trading at $185, exhibiting volatility within a defined range. The 4-hour chart indicates SOL sandwiched between dynamic resistance and support levels, highlighting a struggle for direction. Traders monitor key levels and technical indicators like Bollinger Bands, MACD, Stochastic Oscillator, and RSI for potential breakout or breakdown signals.
4/6/20241 min read
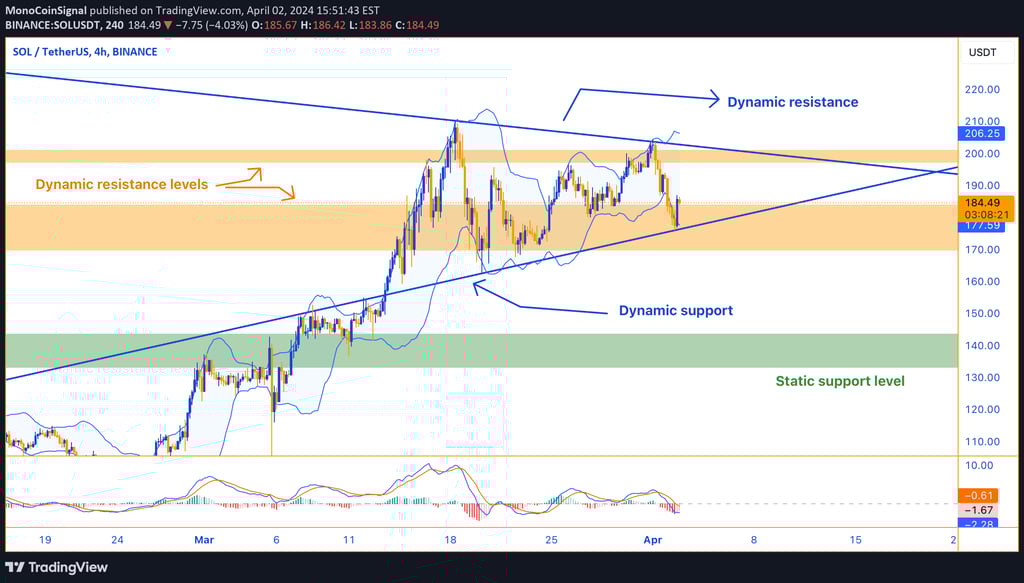
SOL is currently trading at $185, showing some volatility within the established range. The 4-hour chart illustrates a pattern where SOL is sandwiched between dynamic resistance and support levels, indicating an ongoing tussle for direction. Despite the recent 3.32% drop, the price remains within the trading channel defined by these bounds.
The upper Bollinger Band, sitting at $206.19, has proven to be a tough area for bulls to break, aligning with the dynamic resistance that has capped upward movements. Conversely, the lower Bollinger Band at $177.78 coincides with the static support level, suggesting a potential cushion against a further decline.
The trading volume of 92.758K SOL doesn't point to a dramatic shift in market sentiment yet, but it's a figure to watch for any emerging trends. The Simple Moving Average (SMA) at 185.47 is currently in sync with the price, offering a neutral signal.
The MACD indicator shows that bearish momentum might be building, with the MACD line below the signal line and a negative histogram. However, the Stochastic Oscillator (%K at 34.79) isn't in the oversold territory, implying there isn't an immediate turnaround signal from this indicator.
The Relative Strength Index (RSI) sits at a middling 45.44, leaning neither towards overbought nor oversold conditions. This, along with the RSI-based Moving Average, suggests that while there may be short-term bearish pressure, the mid-term trend hasn't turned decisively negative.
Taken together, these indicators paint a picture of Solana experiencing a period of consolidation with potential to swing in either direction. Traders will likely be watching for a breakout beyond the dynamic resistance or a breakdown below support for a clearer sense of direction. The interplay between these technical indicators and evolving market narratives will shape Solana's path in the coming days.