Solana's Surge: Analyzing SOL's Bullish Breakout
Discover the key support and resistance levels for SOL as it experiences a bullish breakout. Learn about the technical indicators driving Solana's price momentum.
ALTCOINS ANALYSIS
4/11/20232 min read
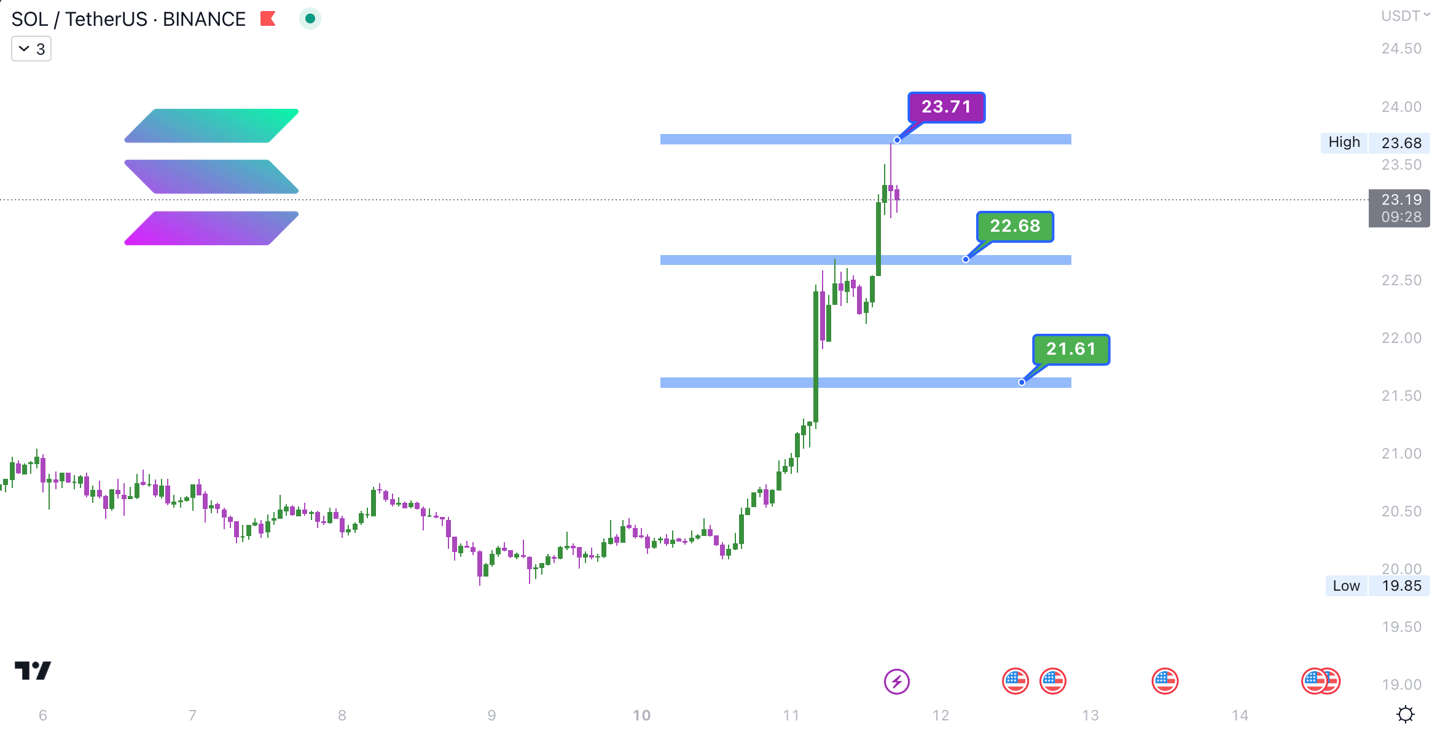
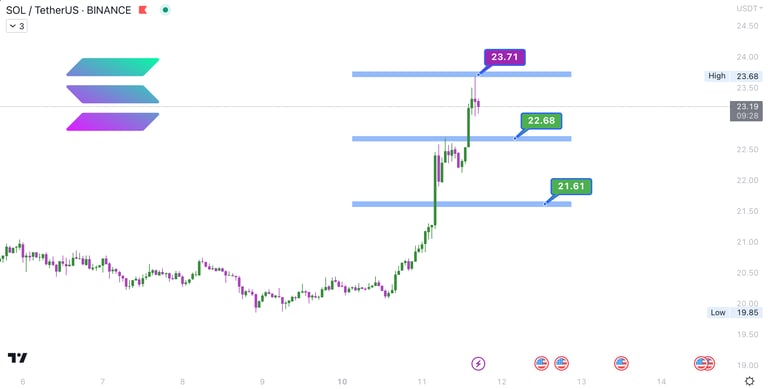
SOL, the native token of the Solana blockchain, has recently experienced a bullish breakout, which is reflected in its current price of $23.25. Over the past hour, we've seen the coin pick up momentum, as various technical indicators suggest that the asset could be gearing up for further gains.
The Relative Strength Index (RSI) is currently at 75, indicating that SOL is in the overbought territory. However, a high RSI can sometimes signal a strong trend, and with the recent news of Solana's impressive technological advancements and partnerships, this could be the case for SOL. The On-Balance Volume (OBV) of 53.917 million also supports this notion, as it suggests an increase in buying pressure, which often precedes a price surge.
The Bollinger Bands provide insight into SOL's volatility, with the upper band at $23.73 and the lower band at $20.55. The middle band, which currently stands at $22.14, acts as a local support level, as it represents the moving average of the asset's price. The 1-hour timeframe Fibonacci levels further reinforce this support, with the 0 level at $22.68, providing an additional cushion for the price.
The 50-hour Exponential Moving Average (EMA) at $21.42 and the 0.5 Fibonacci level at $21.28 serve as strong support levels, forming a solid base for the price to bounce off of if the bullish momentum continues. On the flip side, the 24-hour high of $23.68 presents the nearest resistance level, with the upper Bollinger band acting as an additional barrier.
The MACD indicator at 0.65 and the Stochastic Oscillators at 80 also suggest that the bullish trend may persist in the short term. Additionally, the Volume Oscillator at 3.59% indicates an increase in trading volume, which could fuel the price's upward trajectory.
In conclusion, SOL's recent bullish breakout is supported by a confluence of technical indicators and recent positive news. Key support levels to watch include the middle Bollinger Band at $22.14, the 50-hour EMA at $21.42, and the 0.5 Fibonacci level at $21.28. Meanwhile, the 24-hour high of $23.68 and the upper Bollinger Band at $23.73 serve as the nearest resistance levels. As the market conditions continue to evolve, it's essential to monitor these levels and any relevant news to make informed decisions.
If you're interested in trading Bitcoin or other cryptocurrencies, it's important to stay up-to-date with the latest market trends and technical indicators. At MonoCoin Signal, we provide a platform that enables you to track the latest news, analyze technical indicators, and make informed trading decisions. Sign up today to gain access to our powerful tools and insights and start navigating the volatile cryptocurrency market with confidence.