SOL: Support in Sight
Explore the current dynamics of SOL's trading activity, facing a crucial test at the $104.19 mark. Assess the significance of the lower Bollinger Band, MACD's bearish crossover, and RSI's proximity to oversold territory. Navigate potential scenarios, from a rebound with buyer interest to the implications of a break below critical support. Stay informed for decisive trends by monitoring Bollinger Bands, MACD, and trading volume.
2/22/20241 min read
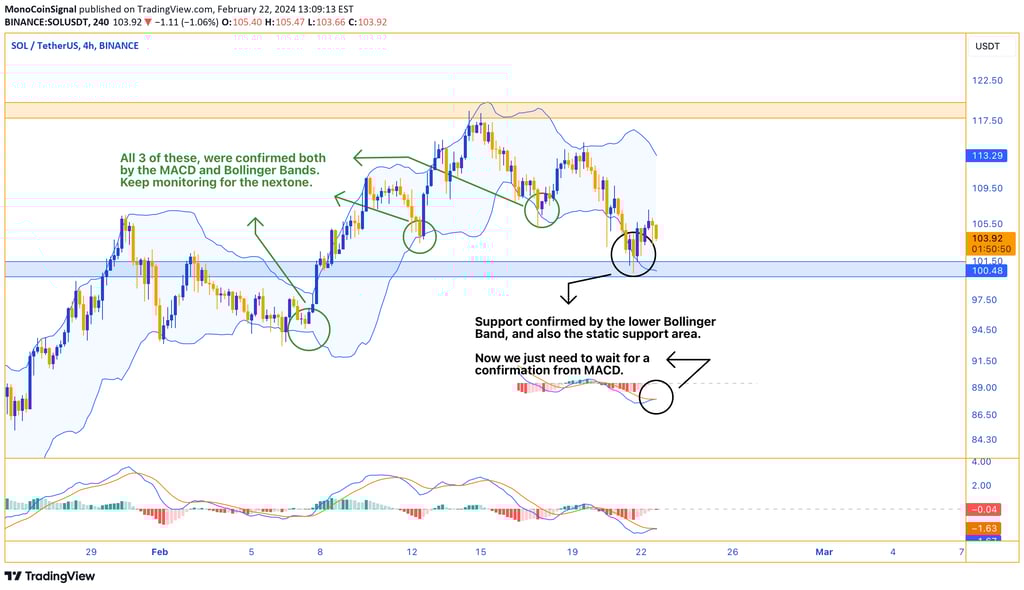
SOL's trading activity presents a testing phase at the $104.19 mark. The proximity to the lower Bollinger Band suggests we're in a critical support region — if this holds, it could signal a potential rebound. The MACD's bearish crossover, while noteworthy, lacks strong momentum, hinting that a downtrend may not be firmly established.
What's pivotal here is the RSI's position near the oversold territory, which could attract buyers looking for value, potentially leading to a price recovery. However, the moderate trading volume indicates that there's not a strong consensus among traders, and we may see some indecision before the next clear trend emerges.
In this scenario, keeping an eye on the Bollinger Bands and the MACD will be key. Should the MACD flatten or turn upward and the price stabilizes above the lower band, it might be the first signs of a bullish reversal. On the flip side, a break below could signal further dips, so watch for any significant volume changes to confirm the move.