Significant triangular pattern
TON is trading within a significant triangular pattern, with key support at $6 and resistance at $7.3. A breakout above $7.3 could lead to a significant price rise, while breaking below $6 might result in a drop.
5/27/20241 min read

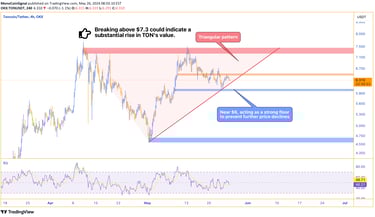
TON is currently within a significant triangular pattern. The primary support level for this cryptocurrency is near $6, while the resistance level is around $7.3.
The support level at $6 acts as a strong floor to prevent further price declines, while the resistance level at $7.3 serves as a significant ceiling to halt further price increases. If the price manages to break through this resistance level, we might witness a significant rise in the value of TON. Conversely, breaking the support level could lead to a price drop.