Short-term Upward Trendline
Ethereum's price has risen from the lower boundary of its trading range, marked by a blue box, toward a resistance box. Concurrently, a bearish pattern has emerged, hinting at a potential price correction. An established upward trend line offers critical support, and the emergence of bullish patterns in this region could propel the price higher towards the orange support zone. Note the pivotal role of the upward trend line; a downward breach might signal a potential decline, possibly extending to the lower boundary of the trading range represented by the blue box.
2/3/20241 min read
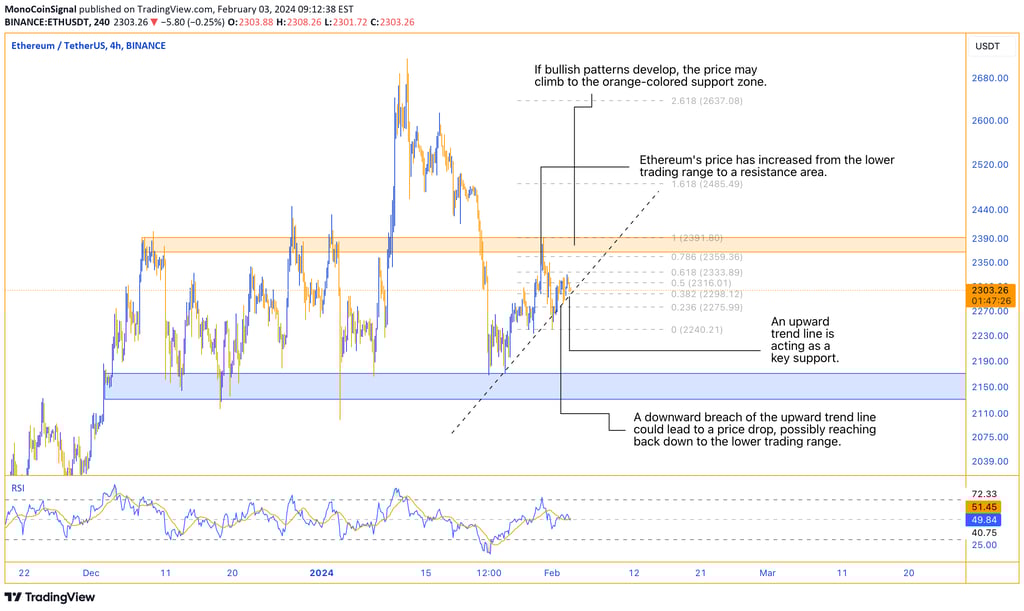
The price of Ethereum has experienced a rise from the lower boundary of its trading range, marked by a blue box, advancing towards an area characterized by a resistance box. This upward movement in price has coincided with the emergence of a bearish pattern, suggesting the likelihood of a forthcoming price correction. In addition, there's an upward trend line that has been established, providing critical support. Should bullish patterns emerge in this region, it is projected that the price will further escalate, aiming for the orange support zone.
A crucial aspect to note is the pivotal supportive role of the upward trend line. A downward breach of this line could signal a potential decline in price. Such a decline might extend down to the lower boundary of the trading range, represented by the blue box.