Short-Term Trends Analysis
Ethereum's recent interaction with key resistance leads to a slight decline. Insightful analysis recommends monitoring for potential trend line breakthroughs and market reactions.
9/5/20231 min read

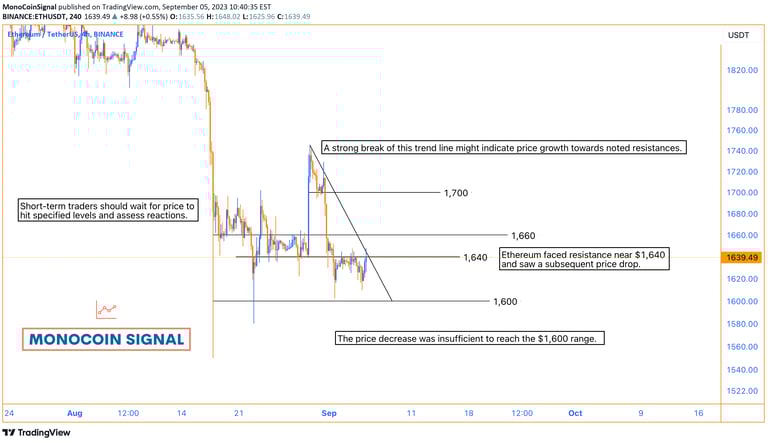
Following its interaction with resistance around the $1,640 mark, Ethereum experienced a decline in its value. However, this decline fell short of reaching the $1,600 range. For those engaged in short-term trading, a prudent approach would involve monitoring the price movement until it reaches the designated levels, while also observing how the market reacts at these levels. Additionally, in the short term, it's worth noting the presence of a downward trend line on the chart. A significant breakthrough of this trend line could potentially indicate a forthcoming price surge towards the indicated resistance thresholds.