SHIB's Market Trend
Daily Fibonacci analysis suggests a potential decline in Shiba's price to the 0.236 level, or even to zero, but anticipates an increase in price if these levels are tested amid the overall upward market trend.
1/10/20241 min read
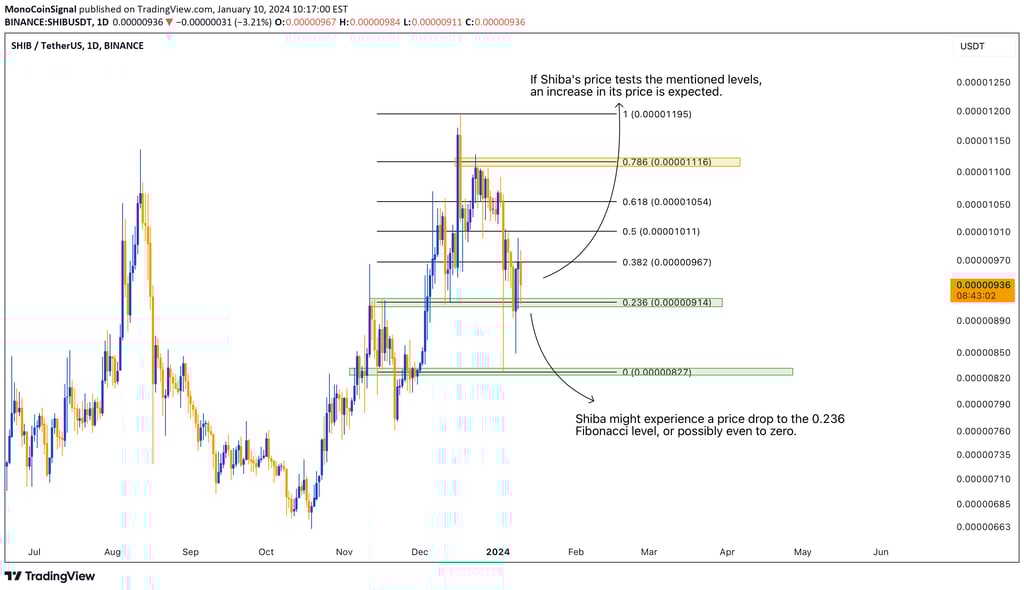
By observing the daily Fibonacci of Shiba, it's possible to predict a potential decline in price down to the 0.236 level, or potentially even to zero on the Fibonacci level. However, considering the overall upward trend in the market, if these specific levels are tested, we anticipate a subsequent increase in Shiba's price.