SHIB's Bullish Breakout
Recent analysis of SHIB suggests a bullish sentiment, with the pair experiencing upward momentum amid significant trading volume. While the Bollinger Bands indicate potential overbought conditions, the MACD and RSI support the bullish outlook, emphasizing the importance of further confirmation.
3/19/20241 min read

Recent market analysis of SHIB indicates a bullish sentiment as the pair experiences an upward trajectory. The price action has shown a positive change, complemented by significant trading volume, pointing towards sustained interest and potential for further gains. The Bollinger Bands suggest a close watch, as the price approaches the upper band, typically a sign of overbought conditions. However, the confirmation of trend direction should be sought with additional indicators.
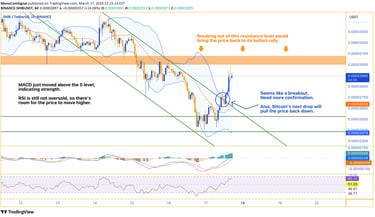
The MACD supports the bullish outlook, with the histogram above zero and the MACD line crossing above the signal line, indicating increasing bullish momentum. Additionally, the RSI sits below the overbought threshold, currently leaving room for further upward movement without being overextended.
A recent breakout above a key resistance level could signal the continuation of the bullish rally for SHIB, although it's important to seek further confirmation to validate this trend. Moreover, it's crucial to consider the correlation with Bitcoin's price movements, as shifts in the leading cryptocurrency often impact altcoins like SHIB.