Risk of a Sharp Downtrend
Weekly technical analysis of HBAR reveals a triangular pattern breakout, achieving the initial target (TP1) before entering a corrective phase. The price is at a significant support area highlighted in blue. Bullish price patterns in this area may lead to a price increase, while a break could initiate a sharp downtrend.
4/16/20241 min read

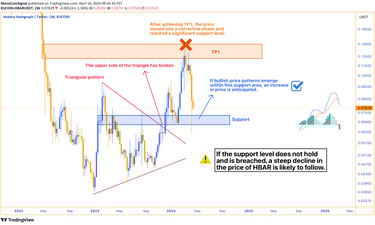
In the weekly technical analysis of HBAR, we observe that its chart has formed a triangular pattern.
Recently, the upper side of this triangle has broken, indicating that the initial target set (TP1) has been achieved.
After reaching this target, the price entered a corrective phase and reached a significant support area, which is highlighted in blue on the chart.
If bullish price patterns are observed in this support area, a price increase is expected to occur again. However, if this support level fails to hold and breaks, a sharp downtrend in HBAR's price is expected to begin.