Riding the Bullish Wave Amidst Voyager-Binance Merger Approval
Discover the latest technical indicators and support levels for VGX in our in-depth analysis. Learn about the impact of Voyager-Binance merger approval on the asset's price.
ALTCOINS ANALYSIS
3/8/20232 min read

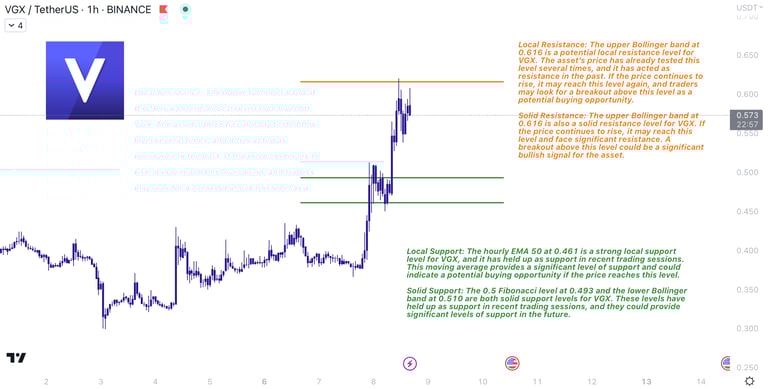
VGX is currently trading at 0.583, which represents a 50% increase in the past 24 hours. This indicates that the asset is experiencing a bullish trend in the short term, and traders may be looking to take advantage of this. However, the RSI of 68 and the stochastic oscillator at 80 suggest that the asset is currently overbought and may experience a correction in price in the near future.
In terms of potential support levels, the hourly EMA 50 at 0.461, the lower Bollinger band at 0.510, and the 0.5 Fibonacci level at 0.493 all provide potential support levels for VGX. These levels suggest that the asset may rebound from these levels if it experiences a price correction. Conversely, if the price continues to rise, the upper Bollinger band at 0.616 may act as a potential resistance level in the future.
The MACD of 0.044 suggests that the momentum for VGX is currently bullish, indicating that the price may continue to rise in the short term. However, the volume oscillator at -8% suggests that trading volume is decreasing, which could lead to lower volatility in the asset's price. This decrease in volume could lead to a decrease in price movement, which may affect the asset's future price.
The recent news regarding Voyager's merger with Binance could have a positive impact on VGX's price. This merger could potentially increase the liquidity of the VGX token, which may lead to increased demand and a higher price for the asset. Additionally, this news could indicate the potential for increased adoption of cryptocurrencies, which could further increase demand for VGX.
Overall, VGX is currently experiencing a bullish trend in the short term, but the RSI and stochastic oscillator suggest that a price correction may occur in the near future. The hourly EMA 50, lower Bollinger band, and Fibonacci retracements provide potential support levels for the asset, while the upper Bollinger band may act as a potential resistance level. The MACD indicates bullish momentum, but the volume oscillator suggests a decrease in trading volume, which could lead to lower volatility in the asset's price. The recent news regarding Voyager's merger with Binance could have a positive impact on VGX's price, and traders should keep an eye on any further developments in this area.
VGX is an asset that has recently caught the attention of traders and investors alike, and its recent surge in price following the approval of the Voyager-Binance merger has only added to its popularity. However, as with any investment, it's important to conduct thorough research and seek professional advice before making any decisions. I hope this article has provided valuable insights into VGX's technical indicators and potential support and resistance levels. If you have any questions or comments, please feel free to leave them below. Thank you for reading, and happy trading!
Best regards,
MonoCoin SIgnal