Pulling back to the broken ascending trendline
Bitcoin Analysis: Trading between $67,000 and $71,000, pulling back to the broken ascending trendline. Await a break above $72,000 for strong growth. Focus on scalping and small swing trades during this corrective wave.
6/18/20241 min read
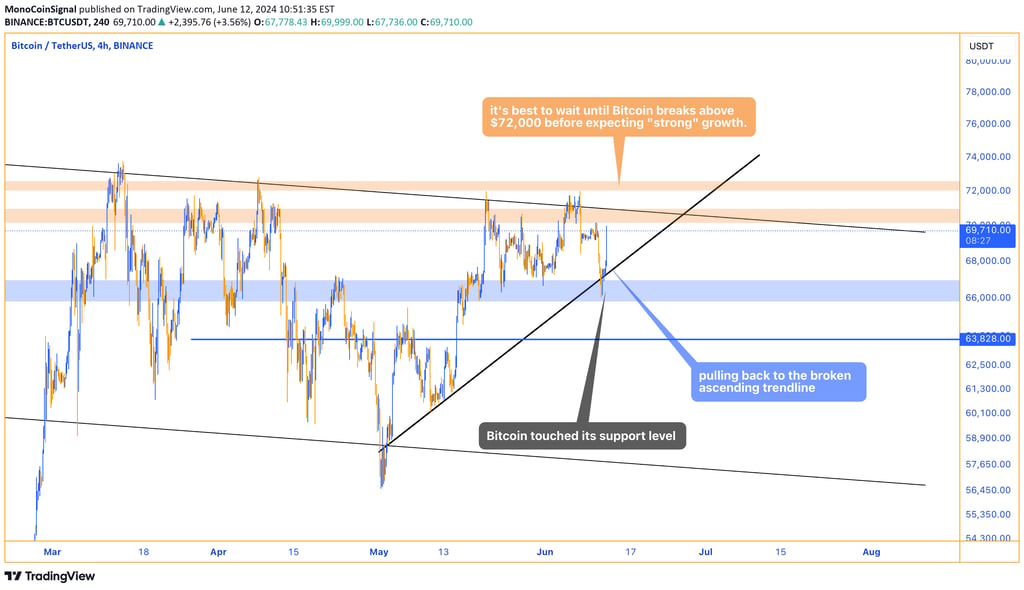
In our previous analysis, we mentioned that we expected Bitcoin to touch its support level, and this indeed happened.
Bitcoin is currently trading between $67,000 and $71,000 and is pulling back to the broken ascending trendline. In our opinion, it's best to wait until Bitcoin breaks above $72,000 before expecting "strong" growth.
While the market is in this corrective wave, focus on scalping and small swing trading opportunities.
Avoid rushing into high-volume trades and make decisions with greater caution.