Previous Resistance Zone
Explore the breakdown of the previous resistance zone on the weekly and daily charts, followed by a confirming pullback. A consolidating candlestick signals a potential upward acceleration in IMX's price trend, targeting higher levels.
3/10/20241 min read
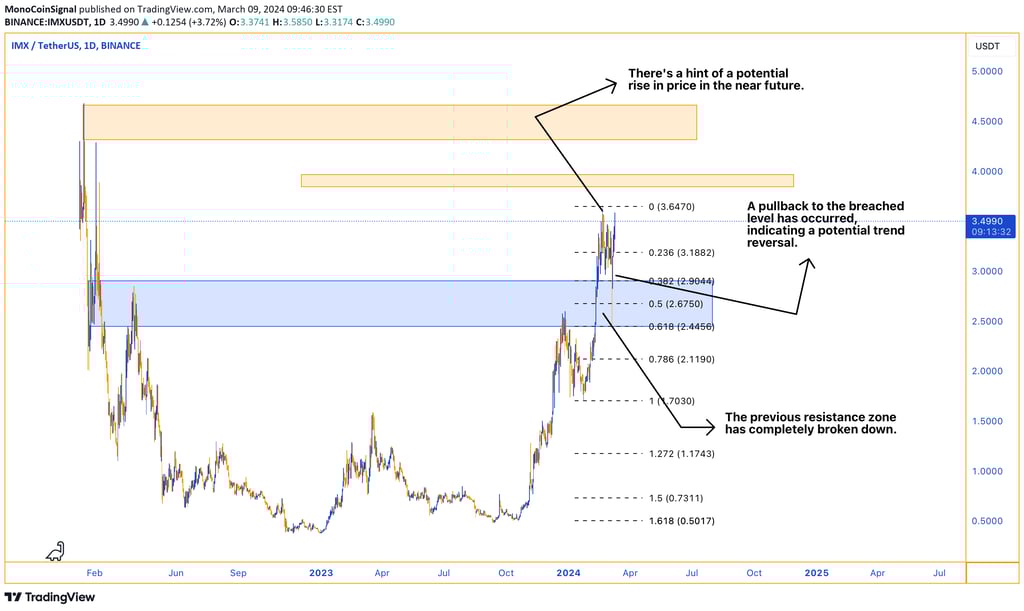
Based on the weekly and daily charts, we have witnessed the complete breakdown of the previous resistance zone. This event is followed by a pullback to the level that had been breached earlier. Such a pullback movement could signify the confirmation of the resistance breach and a change in trend direction.
Observing a consolidating candlestick at this level suggests that the IMX price trend may accelerate in an upward direction, aiming for higher price targets.