Potential Trend Reversal
Explore HBAR's recent 50% surge, encountering resistance at the daily supply zone and descending trend line. A potential downside is anticipated towards the demand area and support level, but a breakout above $0.08900 could signal further growth.
11/21/20231 min read
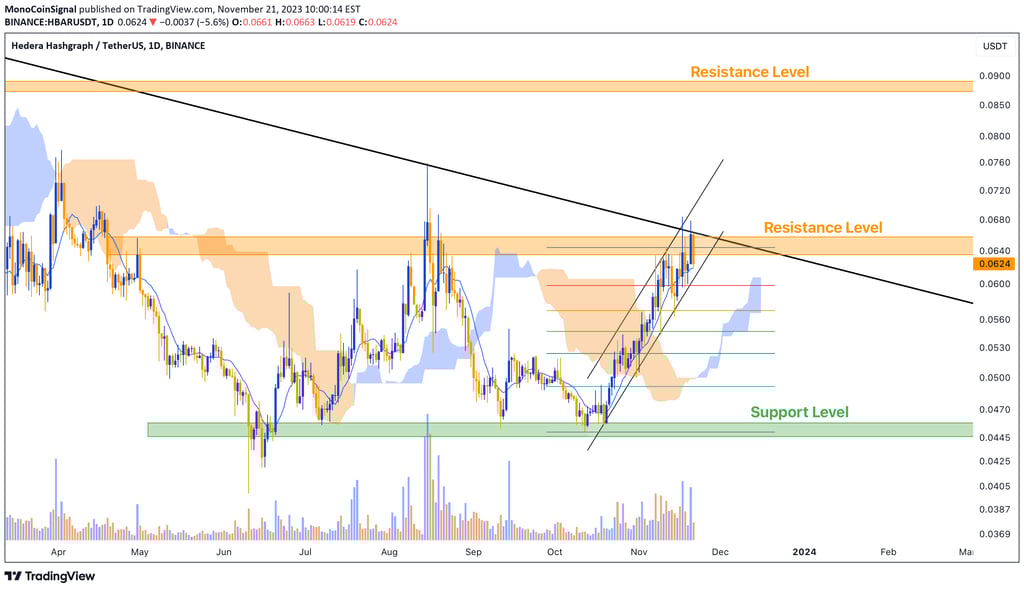
In the daily timeframe, HBAR experienced a significant growth of around 50% after performing well in recent weeks. Eventually, it encountered the area of daily supply and the descending trend line it had. These two areas merged, gaining more strength in this price zone, potentially driving the price downwards towards the demand area and its support level. If this range is invalidated, and the descending trend line we have is broken, HBAR could experience growth towards the price range of $0.08900.