Post-Halving: What to expect?
Bitcoin's price consolidates post-halving, with technical indicators showing bullish signals but also signs of potential overbought conditions. Traders should monitor volume, moving averages, and dynamic resistance levels for insights into market direction.
4/22/20242 min read

The last day saw a moderate decrease in Bitcoin’s price by 0.44%, signaling a consolidation period post-halving. Trading volume stands at 308K; the context of whether this volume signifies a decrease or increase in trader activity could add significant color to current market sentiment.
The price is currently trending below the simple moving average (SMA) of 65,595, which typically suggests a recent downturn or a bearish sentiment starting to creep in. Yet, this needs to be considered within the wider context of post-halving price dynamics and not in isolation.
Examining the Bollinger Bands, Bitcoin's price isn't in the overbought zone but hovers closer to the upper band, indicating the higher end of its recent price range. The positioning provides room for upward movement without immediately suggesting an overbought condition.
The bullish signal in the market is supported by the MACD line surpassing the signal line, a classic bullish indicator, corroborated by a positive histogram value. However, both the Stochastic Oscillator and RSI are flirting with overbought conditions. The Stochastic Oscillator’s %K and %D lines indicate the market could be due for a correction, and the RSI, close to 70, echoes this sentiment. Yet, in a strong bullish phase, these overbought conditions can persist for a while before any corrective action.
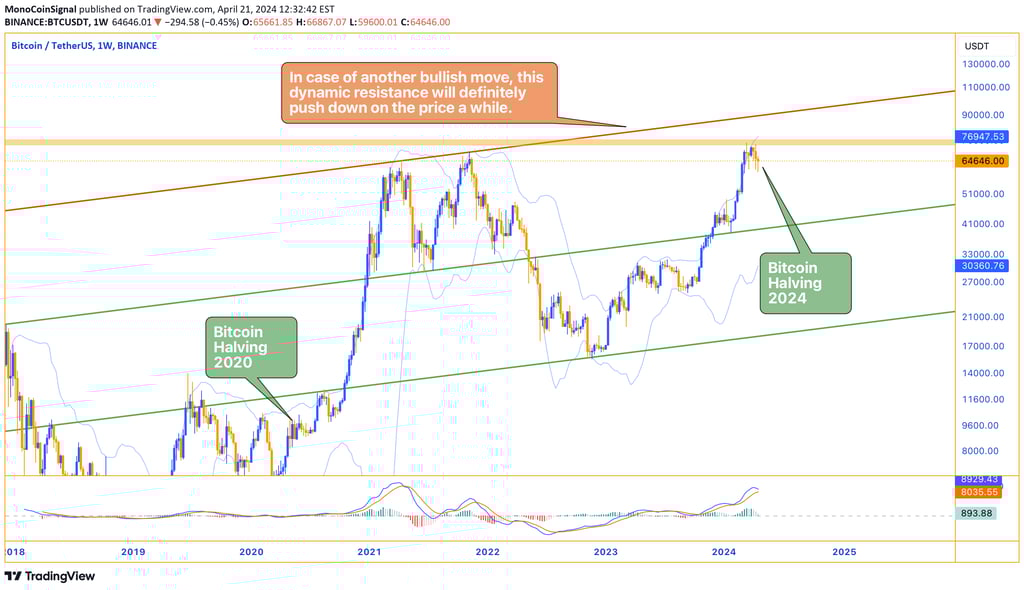
On the chart, we see the price ascending in anticipation of the halving, a common occurrence as market participants speculate on the implications of a reduced future supply. Currently, it’s positioned just below a dynamic resistance line; a break above this could be indicative of sustained bullish momentum, while a rejection could signal an impending downturn or a period of sideways movement.
Overall, the market appears to be in a state of cautious optimism post-halving, with the technical indicators reflecting a recent bullish trend but also suggesting that traders might need to keep an eye out for potential signs of overextension in the market. The watchpoints are the volume-backed price action near the moving averages and the behavior around the dynamic resistance level which will provide clues on whether the bulls can maintain their charge or if bears are about to take control. As always, these insights should be considered as part of a broader strategy that looks at multiple factors, and this is not to be taken as financial advice.