Possible downward move
In ATOM's technical analysis, the $9 to $9.3 range is identified as a strong supply zone, acting as significant resistance. Failure to break this level may lead to a downward move towards the $8.5 to $8.2 demand zone, where a potential rebound could occur.
6/2/20241 min read
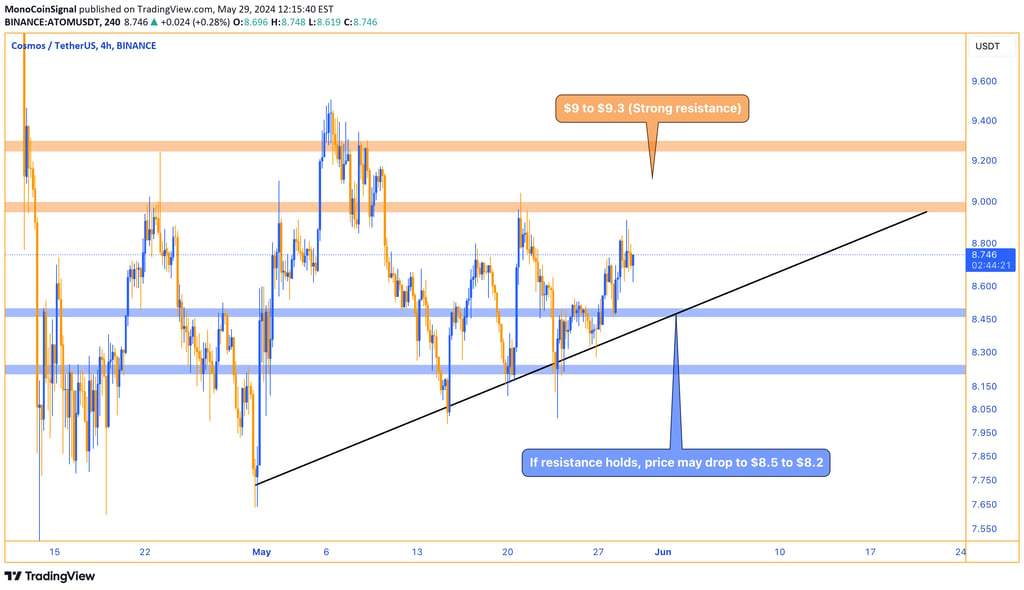
In the technical analysis of ATOM, supply and demand zones as well as key levels can be identified. Currently, the range of $9 to $9.3 acts as a strong supply zone. This area is considered a significant resistance level that can potentially push the price back down to lower levels.
If the price fails to break through this resistance, there is a possibility of a downward move towards the range of $8.5 to $8.2. In this range, there is potential demand that can prevent further price decline and even lead to a rebound.