PEPE: A Meme Coin's Struggle Amidst Market Uncertainty
Our in-depth analysis of PEPE coin covers its current market performance, potential support and resistance levels, and the overall market sentiment.
ALTCOINS ANALYSIS
5/15/20232 min read

PEPE, the meme coin that quickly gained attention due to its astronomical rally and subsequent listing on Binance, is currently fighting against a tide of controversy and bearish market sentiment. Over the past 24 hours, the coin's price has slipped by 8%, with its current trading price standing at 0.00000170.
In a recent development, Pro-XRP lawyer John Deaton voiced his concerns about PEPE, suggesting the coin could potentially be a calculated scam. This assertion, which caused a stir within the crypto community, was based on DeFi analyst Chris Blec's warnings about the coin. The controversy has added to the already shaky market sentiment around PEPE, which is reflected in the coin's technical indicators.
The Relative Strength Index (RSI) for PEPE currently stands at 47, sitting on the fence between the overbought and oversold territories. This implies a somewhat balanced market situation, with neither the bulls nor the bears gaining a definitive upper hand.
However, a deeper look into the other indicators paints a slightly more concerning picture. The Stochastic Oscillators sit at 66, which, while not in the overbought territory, is leaning towards it. The On-Balance Volume (OBV) indicator, measuring cumulative trading volume to help determine the strength of price trends, is currently at a hefty -43T, suggesting a significant skew toward selling volume.
Furthermore, the Moving Average Convergence Divergence (MACD), a trend-following momentum indicator, sits in the negative territory at -0.00000005, hinting at a bearish momentum. Compounding this bearish outlook is the fact that the coin's current price is below the hourly Exponential Moving Average (EMA) of 50 at 0.00000174, indicating an overall downward trend.
The Bollinger Bands, a tool often used for identifying overbought and oversold conditions, show that PEPE is trading just below the middle band (0.00000171), signaling neutral momentum. The price also hovers just above the lower band (0.00000169), possibly indicating a support level.
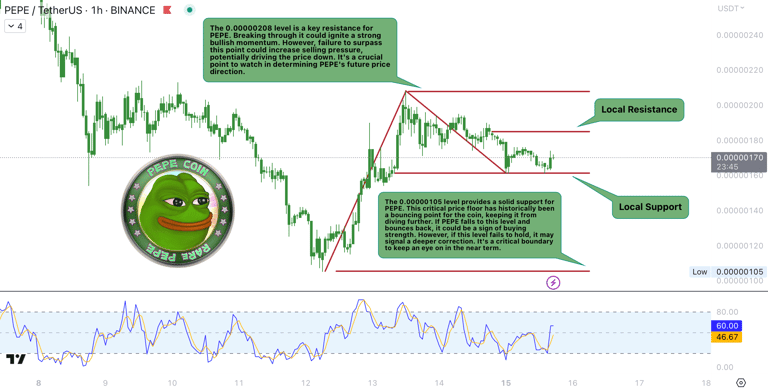
Yet, amidst this bearish momentum, hope for PEPE investors might lie in the Fibonacci retracement levels. Derived from the 0-level at 0.00000208, the 0.5-level at 0.00000179, and the 1-level at 0.00000166, we can identify potential support and resistance levels. The price seems to have local support near the 1 Fibonacci level (0.00000166). If the price breaks below this, we might see it drop further toward lower Fibonacci levels, which could lead to increased sell-offs.
In conclusion, the current market indicators for PEPE, coupled with the swirling controversy and bearish sentiment, present a challenging scenario for the meme coin. While there are possibilities of a bounceback, investors are advised to exercise caution and keep a close eye on market trends and news developments. Remember, in the world of cryptocurrency, due diligence is always key.