Next resistance area at $0.0400
GALA Analysis: After testing the strong support area at $0.03380, GALA has shown potential bullish momentum with buyers defending this level. Watch for a possible rise towards the $0.0400 resistance.
6/18/20241 min read
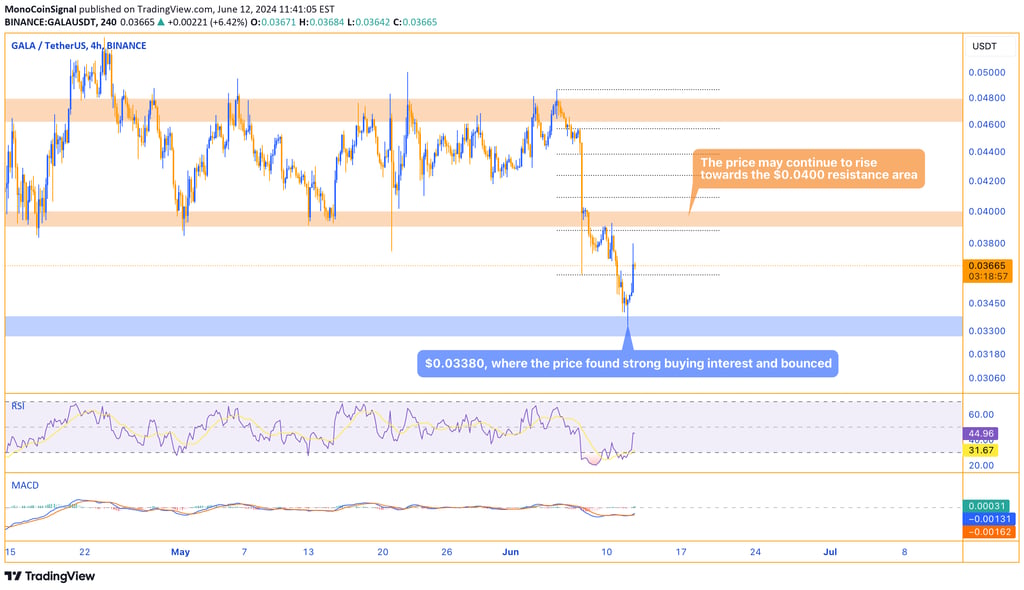
GALA recently tested the support area at $0.03380, which acted as a strong level of buying interest, causing the price to bounce from this level. This rebound indicates that buyers are stepping in to defend the support, suggesting potential bullish momentum. As a result, we may see the price continue to rise towards the next resistance area at $0.0400.