What is the divergence between Bitcoin and Wall Street indices?
BITCOIN
BITCOIN ANALYSIS
After a 22.5% decrease in the price of Bitcoin and falling from the range of $25,000 to $19,000 in the past month, the price trend of Bitcoin has stagnated in the past week, so during the last week's transactions, the price range has decreased significantly. The decrease in scope has been accompanied by a decrease in the volume of transactions.
Meanwhile, the main Wall Street indices continued to decline, which is due to the increased demand for the dollar for security, but the cryptocurrency market did not make heavy declines and remained in its support trenches.
It is interesting to note that although there is a convergence between the Wall Street stock market index and Bitcoin, in this bearish situation and high demand for investors' security, this behavior has become contradictory.
Such behavior can be traced over the past two months when the stock market saw good support but we did not see commensurate behavior in the cryptocurrency.
Perhaps it can be said that the cryptocurrency market has reached a saturation phase, that due to the views on the continuation of inflation control policies, investors do not have hope for growth, but on the other hand, with the huge falls experienced by cryptocurrencies, holders no longer have hope to rely on. They don't know that getting out of loss is profit.
It seems that the goals of contractionary policies have been priced much earlier in the cryptocurrency market and now the market is in the phase of decline and lack of demand as well as lack of supply.
This behavior means that if there is even the slightest sign that the era of control is over, the cryptocurrency market will see a significant and lasting leap.
Technical Analysis:
After the realization of the previous analysis, we will continue to investigate the trend in the four-hour time frame.
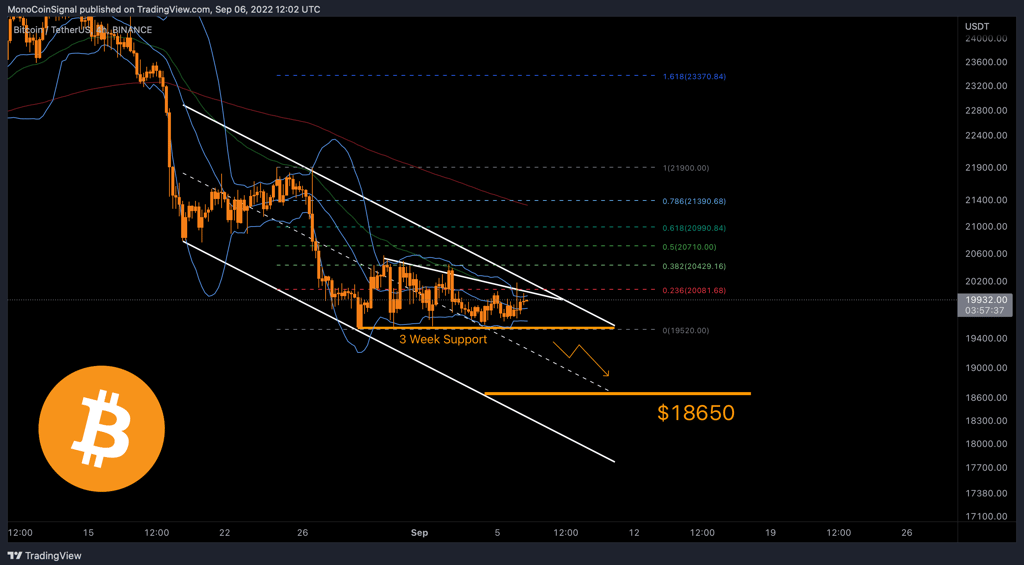
The trend in the recent downtrend channel is losing more and more of its kinetic energy. This behavior has caused a descending triangle pattern to form. Considering the dominant downward trend, it is obvious that one should wait for the signal to continue the trend.
A breakout of the bottom of the pattern provides the expectation for continued decline to the next range of $18,650.