Nearing a Turnaround or Testing Deeper Waters?
Explore the detailed analysis of LQTY's price movements, currently indicating a bearish trend. We consider key technical indicators like MACD, RSI, Bollinger Bands, and Fibonacci Retracement levels to anticipate potential future price actions and reversal points.
10/14/20231 min read
The LQTY price is below the middle band (Basis at 1.454), which often indicates bearish momentum. However, it's approaching the lower band (1.331), suggesting that the asset might be entering oversold territory. If it reaches the lower band, it might experience buying pressure.
The MACD line is below the Signal line, and the histogram is in the negative territory, signaling a bearish trend. This suggests that sellers are currently in control.
The RSI is at 34.87, which is nearing the oversold threshold (30). This could be an early indication that the selling pressure might be exhausting, and a reversal could be on the horizon.
Fibonacci Retracement Levels:
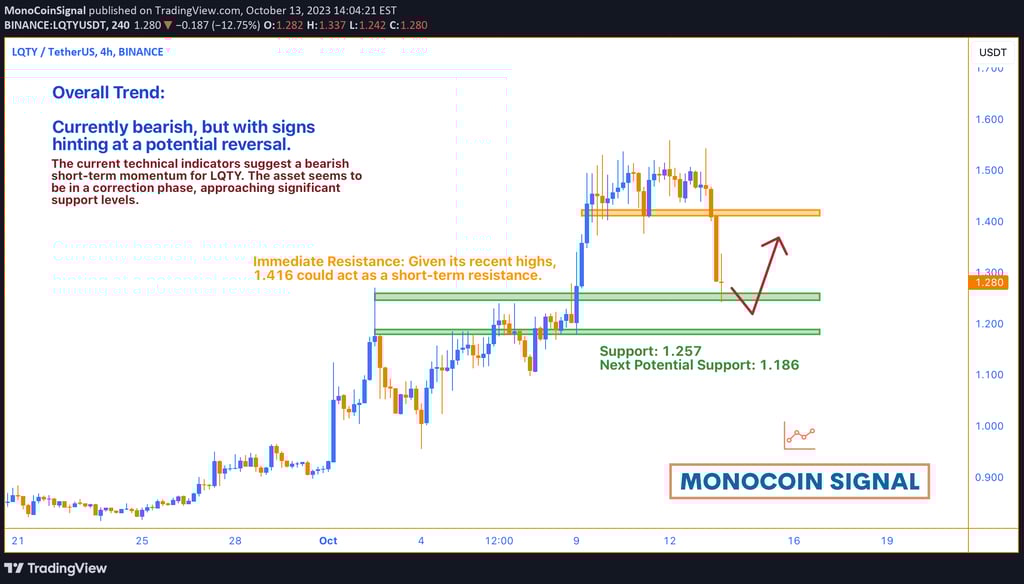
The price is currently near the 0.5 retracement level (1.257). This level often acts as a significant psychological barrier:
If the price maintains above this level, it can act as a support, indicating strength in the asset's price.
If it breaks below, the next significant support is at the 0.618 level (1.186), which might be where buyers step in.
Conclusion and Most Probable Scenario:
The current technical indicators suggest a bearish short-term momentum for LQTY. The asset seems to be in a correction phase, approaching significant support levels. The nearing oversold RSI and its proximity to the 0.5 Fibonacci retracement level might indicate a potential for a bullish reversal soon. However, if the asset fails to hold above the 1.257 level, a further decline to the 1.186 level (0.618 Fibonacci level) could be anticipated.
Overall Trend: Currently bearish, but with signs hinting at a potential reversal.