Navigating the Pivotal $0.777 Juncture
Discover a comprehensive analysis of STRAX on a 1H timeframe, covering trend, volume, Fibonacci retracement, candlestick patterns, and moving averages. Dive deep into the potential bullish and bearish scenarios to make informed trading decisions.
10/25/20231 min read
STRAX has been showing significant activity in recent trading sessions. Analyzing the 1H timeframe gives us insight into its short-term price dynamics. This analysis aims to provide a clearer understanding of the current market structure and potential forward scenarios.
Technical Insights:
Trend Analysis: The 1H chart showcases a potential consolidation phase. STRAX's recent price movements hint at a sideways channel formation.
Volume Profile: A closer look at volume reveals steady trading activity, which supports the current price level.
Fibonacci Retracement Levels: Utilizing the recent swing high and swing low, we can pinpoint critical retracement levels. The $0.777 mark lies close to a key Fibonacci level, further emphasizing its importance.
Candlestick Patterns: Observe for any strong bullish or bearish patterns, which could hint at the next potential move.
Moving Averages: The price being closer to the 1H 50-period MA suggests a critical juncture. A break above could signify bullish momentum, while a break below could be bearish.
Potential Scenarios:
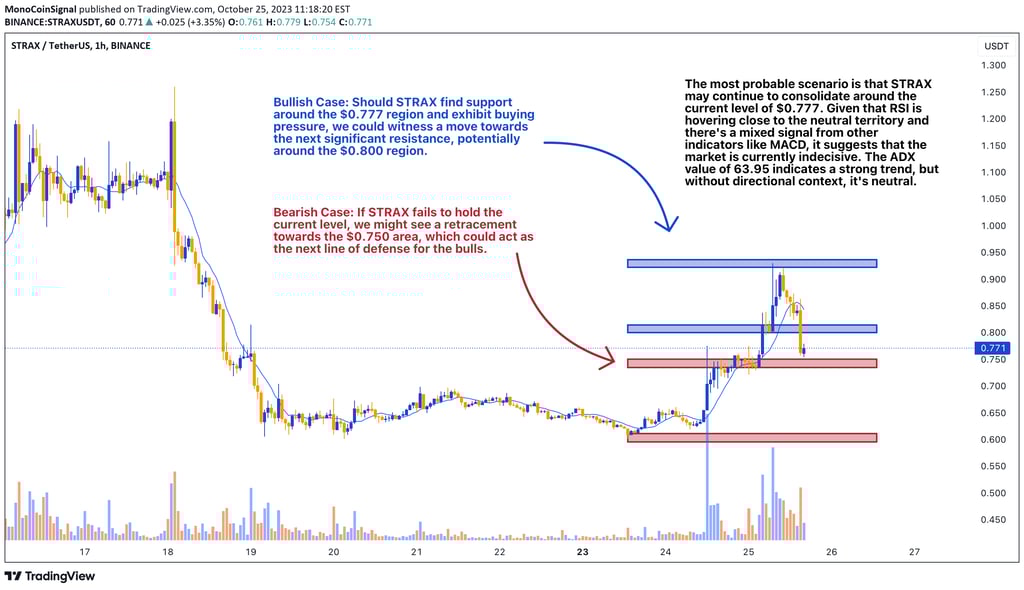
Bullish Case: Should STRAX find support around the $0.777 region and exhibit buying pressure, we could witness a move towards the next significant resistance, potentially around the $0.800 region.
Bearish Case: If STRAX fails to hold the current level, we might see a retracement towards the $0.750 area, which could act as the next line of defense for the bulls.
Conclusion:
STRAX's current position on the 1H chart offers traders an interesting setup. The asset's proximity to significant technical levels provides clear boundaries for potential trade opportunities. Traders should utilize tight risk management protocols, considering the current market dynamics and ensuring they are prepared for both bullish and bearish outcomes.