Moving Towards The Ceiling
Analyzing the weekly chart of ATOM reveals a trading range between two marked zones, indicating relative price stability within an upward trend. The oscillatory movement within this range suggests a correction phase amidst the overall upward trajectory, with the price currently poised for further growth towards the ceiling area.
3/10/20241 min read
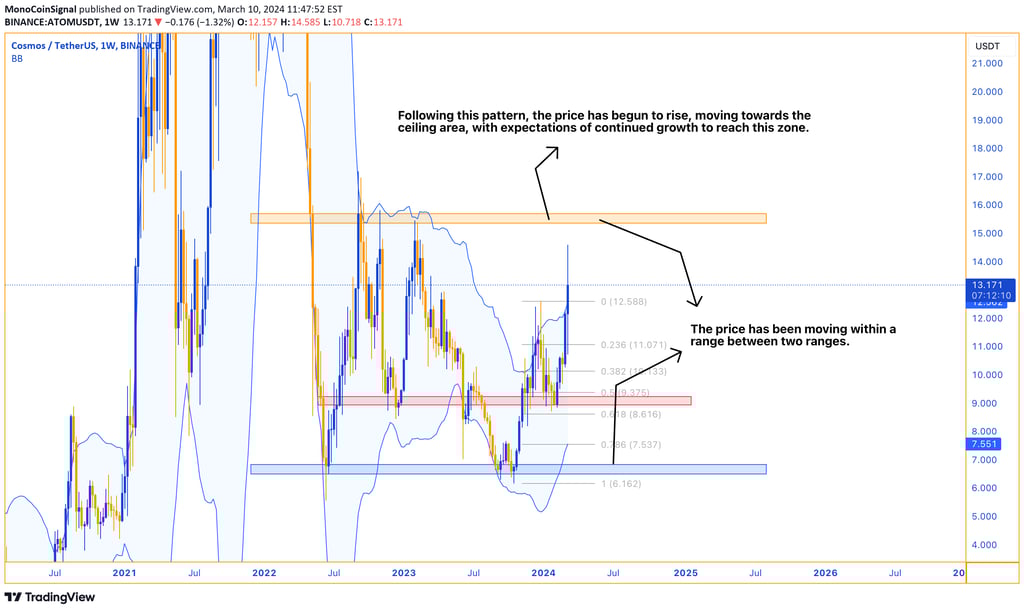
In the weekly analysis of ATOM, the price oscillation between two marked zones stands out. These fluctuations within the ranges are identified as a trading range, indicating a relative stability of the price between these two levels. We witness that this oscillatory movement occurs within the context of an upward trend, where the downward candles represent the market's correction phase. A red box has been considered as a support area, where after reaching this zone, we've observed support and the formation of an ascending pattern. Following the formation of the ascending pattern, the price has started to grow and is moving towards the ceiling area, and it is expected to continue its growth and reach this area.