MonoCoin Signals - Educational
read this post to learn more about trading flowcharts, RSI, Fibonacci, and Bollinger Bands, and how to use them for better crypto trading and forex trading.
EDUCATIONAL - TUTORIAL
Hello, dear TradingView members.
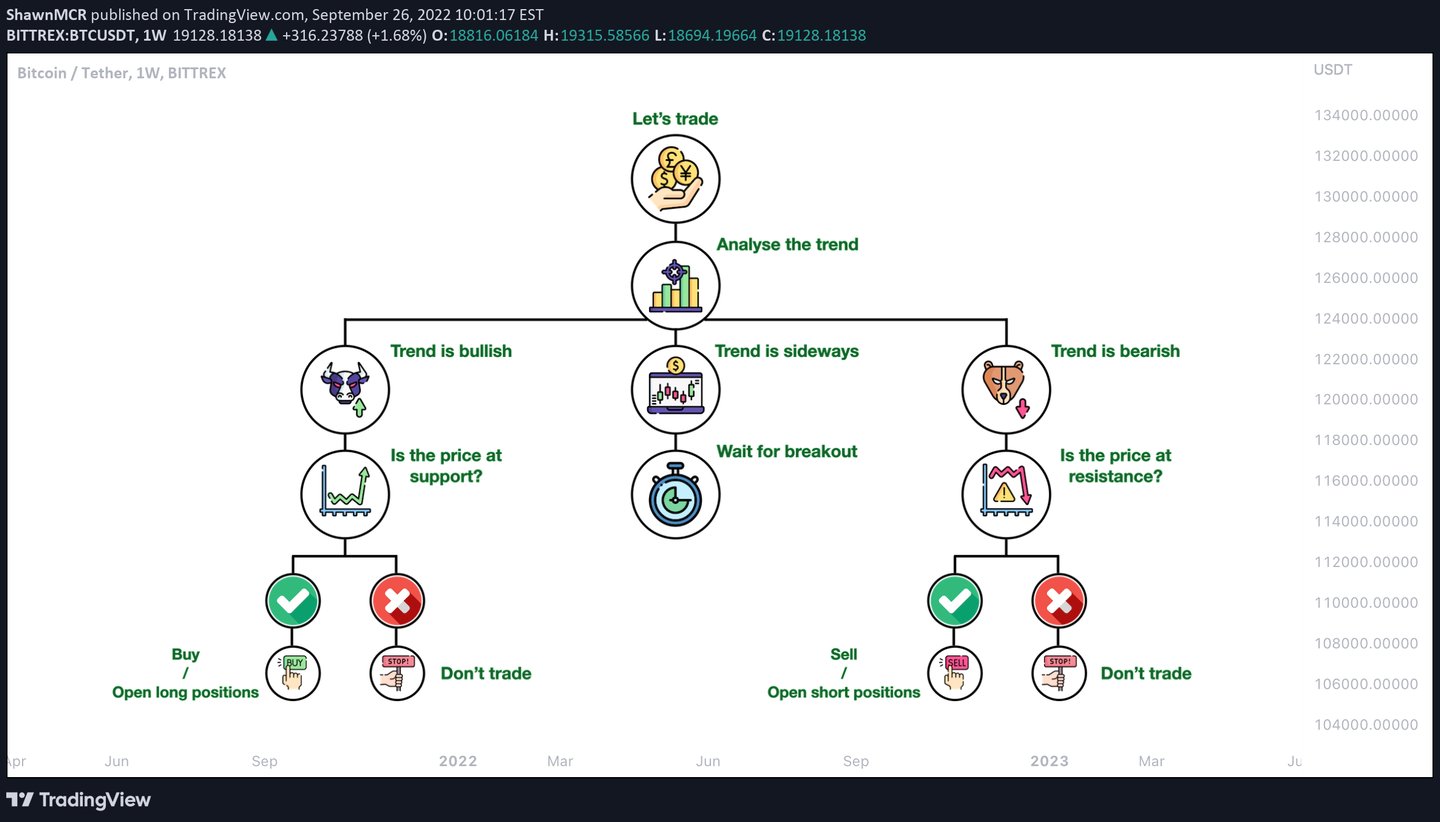
This educational idea is a Trading Flowchart.
It starts with explaining the main steps before trading and opening positions and how to identify our situation to gain better results.
Before we start to trade, we should identify the trend. What is a trend?
A trend is a direction in which an asset's price changes over time.
Financial market traders identify market trends with the help of technical analysis. Technical analysis is a framework that identifies market trends as predictable price trends (when the price reaches a support or resistance level ).
Since future prices are unknown at any given time, a trend can only be determined in hindsight (vs. forward). However, this shortcoming does not stop people from predicting future trends.
The terms "bull market" and "bear market" represent increasing (rising) and decreasing (descending) market trends, respectively.
Peak and bottom:
In the price chart, the bottoms are the points where the demand pressure exceeds the supply, and the prices start to rise after a period of decline. On the contrary, the peaks are the points where the supply pressure exceeds the demand, and the prices start to decrease after an increase.
There are three types of trends in general:
Uptrend (Rising trend)
Sideways trend
Downtrend (Declining trend)
Uptrend (Rising trend):
When the price of a symbol or asset increases generally, the price trend is said to be bullish or bearish. An increasing trend does not mean that the prices always have an upward movement; the price may sometimes go up and sometimes go down, but the result of this fluctuation is the price increase. The rising trend in the price chart can be recognized by looking at rising floors (when the new price floor is higher than the previous floor).
Sideways trend:
A lateral trend line is formed when the market remains stable, i.e., the price does not reach the highest or lowest price point. Many professional traders do not pay much attention to lateral trends. However, lateral trends play an essential role in scalping trades.
Downtrend (Declining trend):
When the price of a symbol or asset declines generally, its price trend is bearish or bearish. A downward trend, like an upward trend, does not mean that the prices will always go down, but it means that the price may sometimes go down and sometimes go up, but the result of this fluctuation is a price reduction. A downward trend in the price chart can be recognized by looking at falling peaks (when the new price peak is lower than the previous peak).
One way an analyst can see a trend line is by plotting trend lines. A trend line is a straight line that connects two or more price points. This line continues on the chart as a support or resistance line.
An uptrend line is a straight line drawn to the right and up, connecting two or more low points. The second low point in drawing the upward trend line must be higher than the starting point. Uptrend lines support and show that even as prices rise, demand is more significant than supply. As long as prices remain above the trendline, the uptrend is considered unchanged. A break below the uptrend line indicates that a change in our trend may occur.
A downtrend line is a straight line drawn to the right and down that connects two or more high points. The height of the second point must be lower than the first point so that the line has a downward slope. Downtrend lines act as resistance and show that supply is greater than demand even as the price declines. As long as prices remain below the trendline, the downtrend is considered intact. A break above the downtrend line indicates that a change in trend may occur.
Familiarity with trend analysis
Trend line analysis is a technique used in technical analysis. Trend analysis seeks to predict the price of a currency in more distant intervals with the help of data obtained by trends. Trend analysis uses historical data like price movement and trading volume to predict long-term trends in market sentiment. Trend analysis tries to predict a trend, such as an uptrend in the market, and follow that trend until the data indicates a trend reversal.
Trend line analysis is essential because trends' movement ultimately leads to investors' profits. Examining a trend with the help of historical data on the desired currency predicts the future price of that currency for traders.
Trading strategies with trend lines
Now that we understand the meaning of trend lines and their types let's look at the strategies many traders use to identify trends and learn when it's the best time to open positions.
To try to make better predictions on how the market will behave, so we can trade safer, we can use indicators.
What are indicators?
In technical analysis, a technical indicator is a mathematical calculator based on price history, volume, or (in the case of a futures contract) options contract information related to the timing of the contracts, which aims to predict financial market trends. Technical indicators are the central part of technical analysis and are usually designed as a chart pattern to predict market trends. Indicators are generally placed on price chart data to show where the price is headed or whether the price is in an oversold or overbought state.
Many technical indicators have been developed, and new types have been invented by traders to obtain better results. New indicators are often simulated on historical price and volume data to see how effective they have been in predicting future events.

Here are a few examples of those indicators:
The Relative Strength Index ( RSI ):
The Relative Strength Index ( RSI ) is a strategy that helps identify currency price movements and buy and sell signals. RSI determines the positive and negative trend of the stock price by observing the average profit and loss in a certain period. The RSI is a percentage ranging from zero to 100 on a scale.
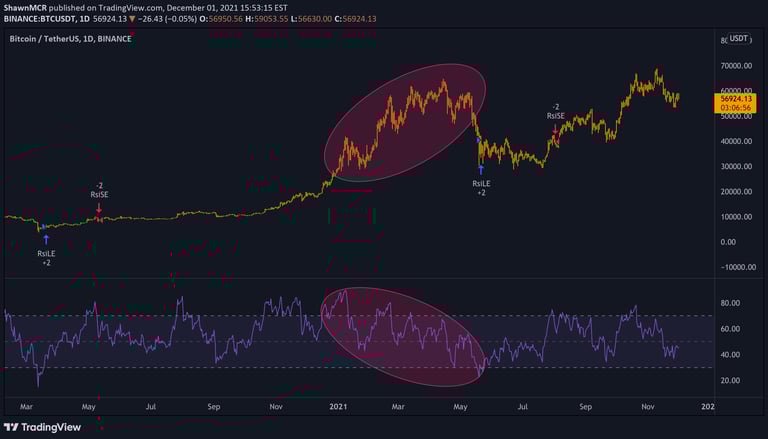
Here is a complete educational idea of how RSI works:
Hello, Let us talk about 'RSI.'
On this chart: We will read about who developed it, how it works, and how it helps us.
Those who read the book called 'New Concepts in Technical Trading Systems' know that RSI was developed by J. Welles Wilder Jr. and published in 1978.
Who is J. Welles Wilder?
He is the creator of several technical indicators that are currently the leading indicators in technical analysis software. These indicators include the Average True Range, the RSI, the Average Directional Index, and the Parabolic SAR.
Let us get to RSI:
The relative strength index is a technical indicator of the analysis used in financial markets. The relative strength index of the share of internal energy of the share to move upwards or fall due to lack of necessary energy.
A tangible example is basketball. If we drop it from above, in multiple collisions with the ground, it will be at a lower altitude each time and eventually land on the ground.
This index has the property of moving averages. It needs the desired period and point number (close, open, and such) to calculate. The big difference is that the mechanism of all moving averages is a sequential and delayed instrument. However, the RSI is an instrument based on moving averages. It is a leading indicator, and this is due to the existence of two levels of support and resistance in the oscillator. Analytical signals are issued when the indicator (line of movement) reaches these levels.
If we are trying to identify Oversold and Overbought conditions, our best options would be Stochastic and RSI.
RSI is scaled from 0 to 100.
The readings above 70 show an overbought condition, and the readings below 30 show an oversold condition.
When we say overbought or oversold, we are pointing out to the face that the market value might reverse. That is why frequently, in overbought scenarios, we obverse a fall, and in oversold scenarios, we can expect a rise in the market value.
Keep in mind that some traders prefer using 20 and 80 instead of 30 and 70. They claim this method reduces the chances of errors and gives more accuracy.
If the readings are moving above 50 (center), we can expect a rising trend, and when the readings are showing a move below the center, we can expect a falling movement.
We can also use this key indicator to identify potential bottoms and tops in the market. That is why it is a great tool to help with confirming trend formations. If we look at a chart and see a bullish or bearish trend, always check the RSI. See if it is above the center or below it. Check for the overbought and oversold situations. This method can reduce our chart reading and trading errors.
How accurate is it?
Accurate return signals are rare and difficult to distinguish from false alarms. For example, a false positive is an uptrend and a sudden drop in stocks. A false negative is a situation with a bearish cross, but the stock suddenly accelerates upwards. Because this indicator shows moving momentum, when an asset has significant acceleration in any direction, it can stay in an overbought or an oversold condition for a long while. Therefore, the RSI is beneficial in volatile markets where the price of assets alternates between uptrends and downtrends.
Suppose you are interested in using this great indicator. In that case, you can go on your TradingView chart and the dashboard, click on 'Indicators & Strategies,' search for RSI, and find the best one suited for you.
Have you ever used this indicator? What do you think the pros and cons are?
Let us know your ideas.
Good luck.
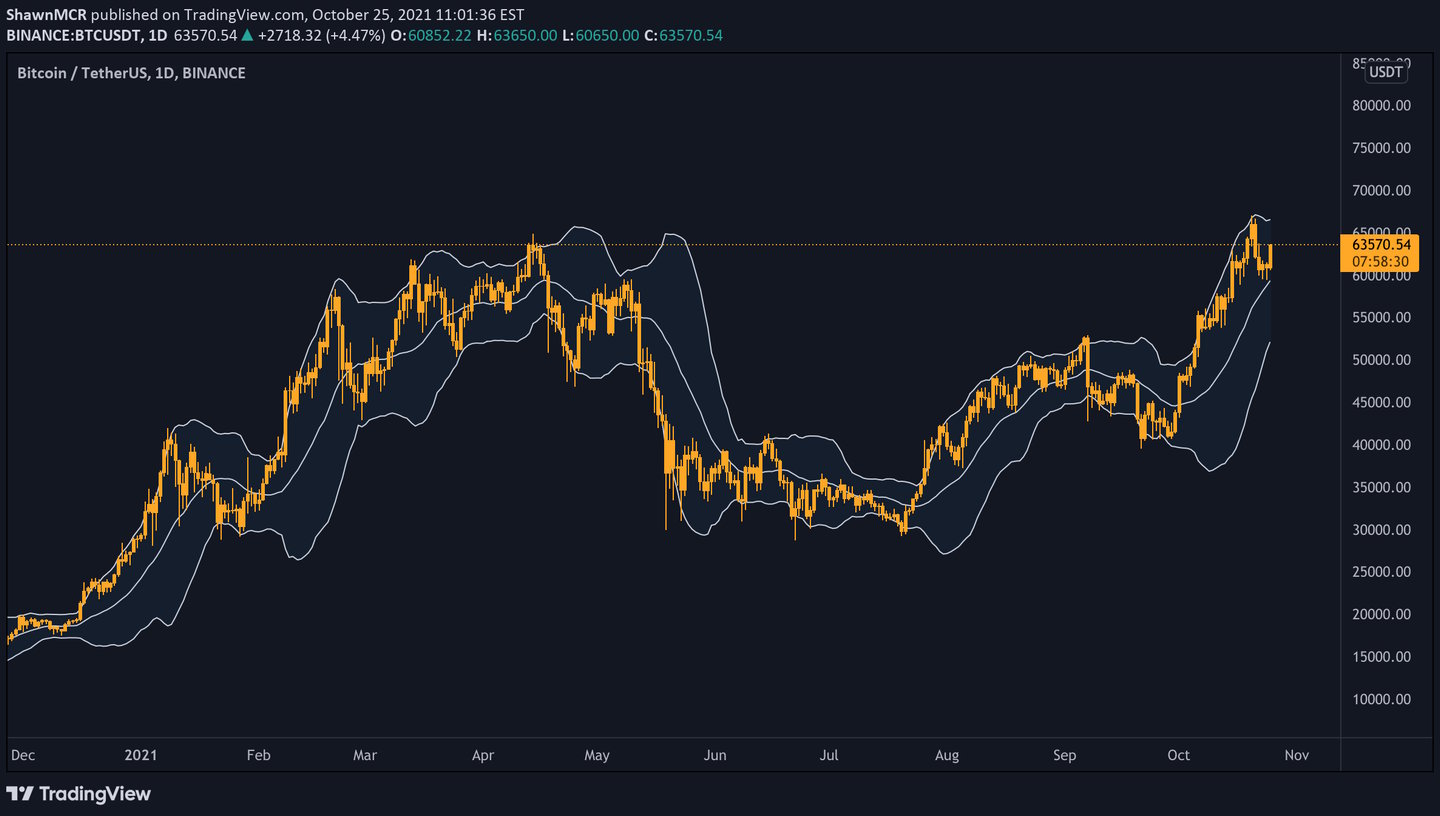

Hello, Let's talk about a great indicator called 'Bollinger Bands.'
On this chart, You'll read what they are, how you can use them, and their limitations.
Bollinger Bands are a trading analysis tool developed by John Bollinger. They are used in market finance for technical analysis and make it possible to assess prices or indices' volatility and probable evolution. John Bollinger first started using this tool in the 1980s.
Bollinger bands consist of three curves, one curve calculating the moving average of the data over N periods and two other curves on either side of the moving average, each located in their initial version at a distance of twice the standard deviation over the N periods over which the moving average was calculated.
Initially, N corresponded to 20 days, but we can calculate the bands over other durations. The distance of the bands can also be changed (e.g., 1.5 or 3 times the standard deviation). With a parameter of 2, if we accept the hypothesis of the normal distribution for the values, 95% of the observed values are statistically located between the two extreme bands.
The bandwidth is a direct indication of the volatility of the asset under consideration. Theoretically, there is more than a 95% chance that the evolution of the value will be established within the framework of the bands adjusted with a distance of two standard deviations. Low volatility is followed by high volatility; conversely, high volatility is followed by low volatility. As a result, when the spreading of the Bollinger bands is low, it is followed by a substantial spread and, therefore, by high price volatility. These then go up and down with a variable slope.
Some people purchase when the price reaches the lower Bollinger Band and exit when the price reaches MA in the middle of the higher and lower bands. Other traders open short positions when the price cuts over the upper Bollinger Band or sell when the price drops under the lower Bollinger Band. Furthermore, the method of Bollinger Bands is not limited to stock traders; options traders, most reputably referred volatility traders, often trade options when Bollinger Bands are historically far separate or purchase options when the Bollinger Bands are historically tight together, in both cases, assuming volatility to relapse to the standard past volatilization level concerning the stock. Once the bands lie close commonly, a time of low volatility is shown. Conversely, as the bars open, price performance/market volatility improvement is foretold. When the bands have only a slight incline and track almost parallel for a long time, the price will frequently vacillate between the bars as though in a tunnel. Traders usually practice Bollinger Bands with other indicators to verify price action. In particular, the advantage of oscillator-like Bollinger Bands will usually be linked with a non-oscillatory indicator-like chart model or a trendline. If these indicators approve the recommendation of the Bollinger Bands, the trader will have higher confidence that the bands are foretelling accurate price action about market buoyancy.
- If the bands squeeze during a phase of low volatility, it increases the possibility of a visible price move in either direction. This may begin a trending movement. Mind out for a false move in the reverse direction, which changes before the proper trend starts.
- When a considerable amount separates the bands, volatility increases, and any existing trend may end.
- Prices bounce inside the bands' box, reaching one round and moving to the other. You can use these rhythms to identify possible profit targets. For instance, if a price is bound off the lower band and crosses over the MA, the upper band matches the profit point.
- Value can pass or touch a bandbox for increased periods through firm trends. You might need to do extra analysis on alteration with a forced oscillator to decide if taking additional profits is suitable for you.
- A powerful trend continuation can be assumed when the price moves outside the bands. Nevertheless, the recommended strength is canceled if prices move instantly back inside the bar.
Bollinger Bands can be applied to discover how well an asset grows and when it is probably turning or losing potency. If an uptrend is big enough, it will reach the upper band constantly. An uptrend that gets the upper band shows that the stock is selling higher, and traders can utilize the chance to make a buy choice. If the value draws back within the uptrends, lingers above the middle band, and moves backward to the upper band, that determines a lot of strength. Frequently, a price in the uptrend should not reach the lower round, and if it does, it is a caution sign for the opposite or that the stock is dropping strength.
Most professional traders try to benefit from powerful uptrends before a reversal happens. Once a stock loses to touch a new height, traders manage to trade the asset at this point to avoid acquiring losses from an inverted trend. Professional traders observe the performance of an uptrend to know when it shows power or weakness, and they apply this as an implication of a potential trend refusal.
Bollinger Bands can decide how well an asset is dropping and when it is likely turning to an upside trend. In a pronounced downtrend, the price will move on with the lower band, which explains that selling action remains powerful. But if the price collapses to reach or move along the lower band, it is a sign that the downtrend may be losing force. When there are price pullbacks, and the price lingers under the middle band and then goes back to the lower band, it means a lot of downtrend pressure. In a downtrend, prices should not break over the upper band since this would suggest that the trend may change or decrease.
Many traders avoid buying through downtrends other than looking for a chance to buy when the trend reverses. The downtrend can remain for short or long durations – minutes to months or even years. Investors must recognize any indication of downtrends quickly enough to protect their investments. If the lower bands display a constant downtrend, traders must avoid opening into long trades that show unprofitable.
Trading W-Bottoms and M-Tops:
W-Bottoms and M-Tops identified 16 models with a fundamental W-Pattern and M-Pattern. Bollinger Bands apply W patterns to classify W-Bottoms when the other low is cheaper than the first low but continues over the lower band. It happens when a common response forms near to or under the lower band. The price then tends back towards the middle or higher and builds a new low price that stays lower.
Limitations of Bollinger Bands:
Although Bollinger Bands are practical tools for professional traders, traders should analyze a few limitations before applying them. One of these conditions is that Bollinger Bands are fundamentally reactive, not predictive. The bands will respond to changes in price movements, either uptrends or downtrends, but will not foretell prices. Like most professional indicators, Bollinger Bands are a lagging indicator. Although businesspeople may use the bands to measure the trends, they cannot apply the tool alone to make price forecasts. John Bollinger suggests that traders use two or three non-correlated tools that give more literal market signals.
Another limitation is that the official settings will not operate for all traders. Traders need to discover settings that let them set guidelines for particular stocks they purchase. If the chosen band settings fail to work, traders may change or use another tool entirely. Bollinger Bands' effectiveness varies from market to market, and traders may be required to modify the settings if they are trading equal protection over some time.
Also, if you're interested to learn more about Bollinger Bands, visit: https://www.bollingerbands.com/.
Bollinger Bands® is the Registered Trademark of John Bollinger
Citation:
https://www.bollingerbands.com/
https://en.wikipedia.org/wiki/Bollinger_...
Bollinger Bands® is the Registered Trademark of John Bollinger
I used some sentences from Wikipedia and BollingerBands since they were explained best for you guys to understand.

Hello, Let us talk about 'Fibonacci.'
On this chart: You will read about where it came from? Why do we use it, and where does it help us.
Before we dive in to talk about Fibonacci Retracement levels and their use in trading, Let us talk about the origin of Fibonacci:
It all started with rabbits.
Yes, Rabbits!
Fibonacci became interested in a strange issue in 1202. He wanted to know the outcome if he had a pair of male and female rabbits and defined behavior for their offspring. The assumptions were as follows:
We have a pair of male and female rabbits that have just been born.
Rabbits mature after one month.
The gestation period of rabbits is one month.
When a female rabbit reaches puberty, she must become pregnant.
At each pregnancy, the female rabbit gives birth to one male rabbit and one female rabbit.
Rabbits never die.
Calculate how many pairs of this type of rabbit we will have after n months?
In mathematics, the Fibonacci sequence or series is the following infinite sequence of natural numbers:
0,1,1,2,3,5,8,13,21,34,55,89,144,233,377,610,987,1597,...
Take a look at this GIF to get an idea of this infinite sequence:
https://drive.google.com/file/d/1W7Q9gRsOPLrFl-breUA6yo77eGob0zmq/view?usp=sharing
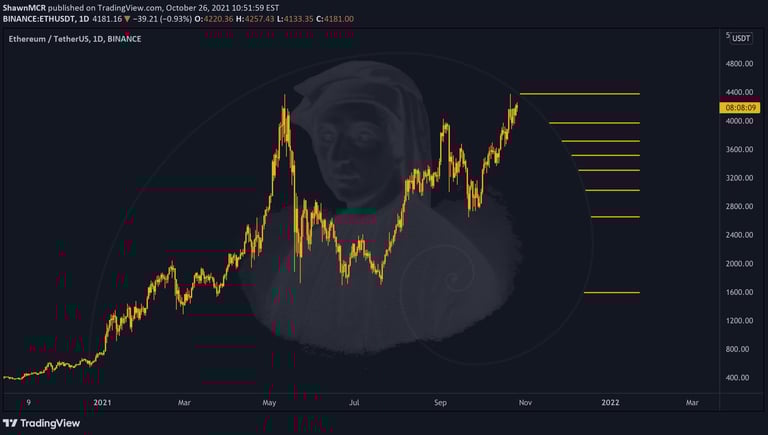
The Fibonacci spiral: an estimate of the golden spiral generated by drawing circular arcs attaching the facing corners of the squares adjusted to the values of the sequence; by successively attaching squares of side 0, 1, 1, 2, 3, 5, 8, 13, 21 and 34.
The sequence begins with the numbers 0 and 1; "each term is the total of the past two" is the recurrence relation that defines it.
The elements of this sequence are called Fibonacci children. Leonardo de Pisa described this sequence in Europe as a 13th-century Italian mathematician, also known as Fibonacci. It has numerous applications in computer science, mathematics, and game theory. It also appears in biological configurations, such as in the branches of trees, in the arrangement of leaves on the stem, in the flowers of artichokes and sunflowers, in the inflorescences of Romanesco broccoli, in the configuration of coniferous conifers. In rabbits' reproduction and how DNA encodes the growth of complex organic forms. Similarly, it is found in the spiral structure of the shell of some mollusks, such as the Nautilus.
Leonardo Pisano, Leonardo de Pisa, or Leonardo Bigollo, also known as Fibonacci, was born in 1170 and died in 1240. Long before being known in the West, the Fibonacci sequence was already described in mathematics in India in connection with the Sanskrit prosody.
Susantha Goonatilake notes that the development of the Fibonacci sequence "is attributed in part to Pingala (year 200), later associated with Virahanka (about 700), Gopāla (about 1135) and Hemachandra (about 1150)". Parmanand Singh cites Pingala (around 450) as a forerunner in the discovery of the sequence.
Now let us talk about Fibonacci in the finance world. You might use it too, as Fibonacci Retracement Levels. (As you see on the chart)
The second law of technical analysis indicates that values move in trends, bullish or bearish. Once a trend has given sufficient signs of termination, either by breaking its trend line, confirmation of a trend reversal figure, or any other valid factor according to technical analysis theory, the analyst contemplates the possibility of a setback. A pullback represents, in simple terms, a move in the opposite direction to the past trend. It can take the form of a crash in price after a bullish move or a rebound in price after a downtrend. Although the first could properly be called a retracement and the second rebound or rally, technically, the term retracement includes both.
Within technical analysis, Fibonacci retracements refer to the possibility that the price of a financial asset will retrace a considerable portion of the original movement and find support or resistance levels at the levels set by the Fibonacci numbers before continuing. The above address. These levels are constructed by drawing a trend line between the extreme points of the movement in question and applying the critical percentages of 23%, 38.2%, 61.8%, 76.8%, and 100% to the vertical distance.
Fibonacci retracements are used to confirm suspicions of a market movement. Levels of support and resistance can indicate possible bullish or bearish market trends and indicate to people the best time to open long or short positions. This means that Fibonacci retracements can be highly fulfilling for people who know when to use them correctly.
Upon confirmation of rejection in the price, we will try to calculate the probable magnitude of the movement. To achieve this, specific percentages collected from the Fibonacci series are applied to the total magnitude of the previous trend. The percentages used are as follows:
61.8%: Also recognized as the Golden Ratio, or golden number, it is the limit of the result obtained from the division of an element of the Fibonacci series by the following number, as the series tends to infinity.
38.2%: It is obtained by subtracting 61.8% from the unit (1.000 - 0.618)
100.%: Equivalent to the total magnitude of the primary trend.
Reversal percentages should be calculated after the end of a trend has been confirmed, never while the trend continues.
Considering that trends are always part of a longer-term trend and, in turn, are made up of shorter-term trends, the question on, which of these trends should be calculated as setbacks? There might not be a simple answer. We must calculate the setbacks on that trend that has given clear signs of termination in general terms.
A weak trend may have a 31.8% retracement, while a powerful trend may have a 61.8% retracement before returning to its original direction.
Some sources mention a critical zone of 33 to 38.2% and 61.8 to 67% instead of specific levels.
Fibonacci retracements form an essential part of the Elliott Wave Theory.
The most scathing criticisms against Fibonacci retracements are based on the random walk theory, arguing that there is no justification for assuming that price action has any reason to respect predetermined retracement levels.
However, it is not suitable to use Fibonacci retracement all the time. There are a few downsides too:
Fibonacci retracement shows only static price levels. It is unlikely to say that a specific cryptocurrency price will not pass or stay below predicted levels.
Many external factors determine the price of a coin. They have to be taken into account when determining trading decisions.
Fibonacci retracement levels are close to each other, so it is challenging for a professional trader to determine the accuracy from which to predict a particular coin's future value.
Suppose you're interested in using this great indicator. In that case, you can simply go on your TradingView chart and the dashboard, click on 'Indicators & Strategies,' search for Fibonacci and find the best one suited for you.
Have you ever used this indicator? What do you think the pros and cons are?
Let me know your ideas.
Good luck.
Don't forget to check out monocoin.net for more crypto analysis and crypto signals.
You can also join our channel to receive telegram crypto signals for crypto and forex.
Join the MonoCoin Signal VIP to receive the best cryptocurrency signals and analysis.
MonoCoin Signal also provides crypto tutorial content for crypto trading for VIP users, so they can gain more profits.