MKR: Bullish Potential Ahead?
Comprehensive technical analysis of MKR on the 1H timeframe, revealing a mix of bullish and bearish patterns. Dive deep into indicators like Bollinger Bands, SMA, MACD, and RSI to decipher MKR's potential price direction in the coming sessions.
10/25/20231 min read

MKR has displayed a mix of bullish and bearish patterns in recent times. Let's dive in.
Analysis:
Recent Uptrend: Post 19th, MKR showed a strong bullish sentiment, climbing steeply until facing a sharp decline around 23rd.
Bollinger Bands: The current price of 1497 is hovering near the basis, indicating that MKR is trading within its typical range. The narrowing of bands suggests a potential for a breakout in either direction.
SMA & MA: The Moving Average (MA) stands at 1494, which is almost in alignment with the current price. This further confirms the consolidation phase.
ADX: With an ADX value of 34.39, the trend strength is moderate. It indicates that the current trend, whether bullish or bearish, has some strength but is not extremely strong.
ATR: A value of 28 indicates moderate volatility. Traders should be prepared for price movements but not expect drastic swings.
Chaikin Money Flow (CMF): A negative value of -0.19 signifies more selling pressure than buying, suggesting bearish sentiment.
MACD: The MACD being below the signal line and a negative histogram indicates bearish momentum.
On-Balance Volume (OBV): At 105.63K, the OBV suggests a balance between buying and selling pressures.
Relative Strength Index (RSI): The RSI value of 42.47 indicates that MKR is neither overbought nor oversold, but leaning towards the oversold territory.
Stochastic Oscillator: With %K at 25.22 and %D at 19.42, there might be a potential bullish crossover, indicating a possible upward move.
Most Probable Scenario:
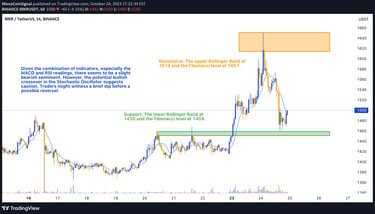
Given the combination of indicators, especially the MACD and RSI readings, there seems to be a slight bearish sentiment. However, the potential bullish crossover in the Stochastic Oscillator suggests caution. Traders might witness a brief dip before a possible reversal.
Conclusion:
The current landscape for MKR in the 1H timeframe is that of caution. While the short-term sentiment seems bearish, indicators like the Stochastic Oscillator signal potential reversals. Traders are advised to keep a close watch on the key prices mentioned and set their strategies accordingly.