Lower Boundary Of The Trading Range
XLM is navigating a trading range between $0.1015 support and $0.1350 resistance. The current downtrend aims at the lower boundary, hinting at a potential bearish trend within this price corridor.
1/10/20241 min read
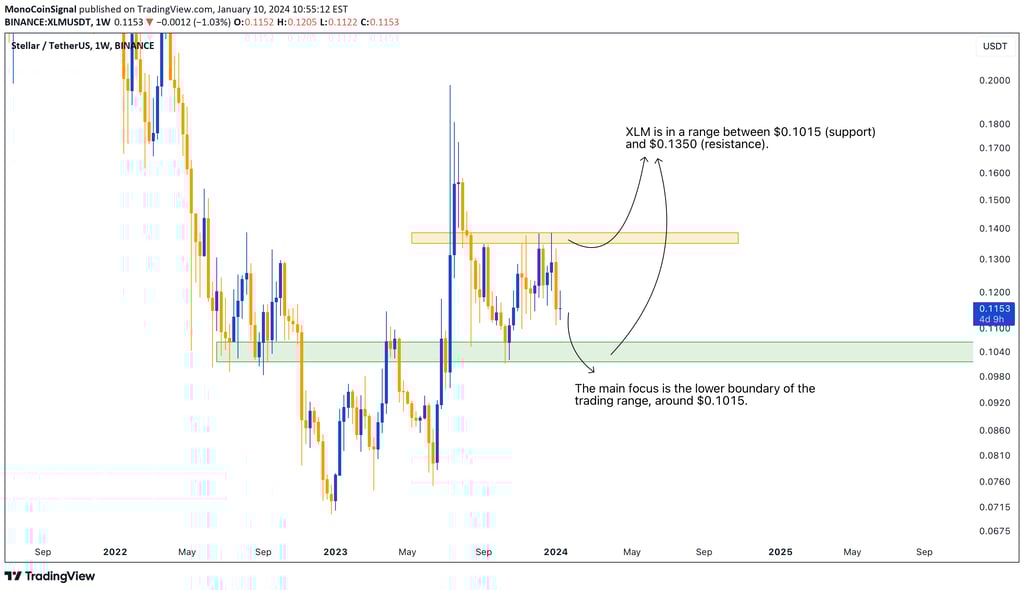
XLM is currently positioned within a trading range, marked by a support level at $0.1015 and a resistance level at $0.1350. At present, the price is following a downward trajectory, aiming to reach the lower boundary of this trading range. This indicates that the focus is on reaching the support level at $0.1015, suggesting a potential bearish trend within this specified price corridor.