LINK: Breakout or Breakdown Ahead?
Delve into an in-depth technical analysis of the LINK/USDT pair on the 1-hour chart. Understand the significance of Fibonacci levels, volume dynamics, and other technical indicators as LINK approaches a pivotal juncture. Discover the potential bullish and bearish scenarios and prepare for the next major move.
10/25/20232 min read
In this analysis, we'll be diving deep into the LINK/USDT pair in the 1-hour timeframe, factoring in current price dynamics and potential market movements.
Analysis:
Fibonacci Levels: From the given Fibonacci retracement, it's evident that LINK has respected the 0.618 retracement level at $10.581, which seems to be acting as a resistance. The 0.236 retracement level at $10.012 may serve as immediate support, making it a critical price point to monitor.
Price Structure: The recent price trend has seen a bullish impulse followed by a consolidation phase. LINK is currently trading near the lower end of this consolidation.
Volume: There's a notable surge in volume during upward movements, indicating strong buying interest. A decline in volume on the pullbacks suggests that the bearish momentum is not as strong.
Bollinger Bands: LINK is trading within the bands, suggesting a neutral trend. A break above the middle band might signify a potential bullish movement.
Ichimoku Cloud: The cloud indicates a bullish sentiment in the recent past, though currently, the price is testing the support of the cloud.
SMA: The current price is near the SMA, indicating a potential pivotal moment.
SAR: The SAR points are above the price, which usually signals a bearish trend. It would be crucial to see if the price can flip the SAR to below, indicating a bullish reversal.
Most Probable Scenario:
Based on the current setup and technical indicators, LINK might be preparing for a potential break in either direction. The key levels to watch are:
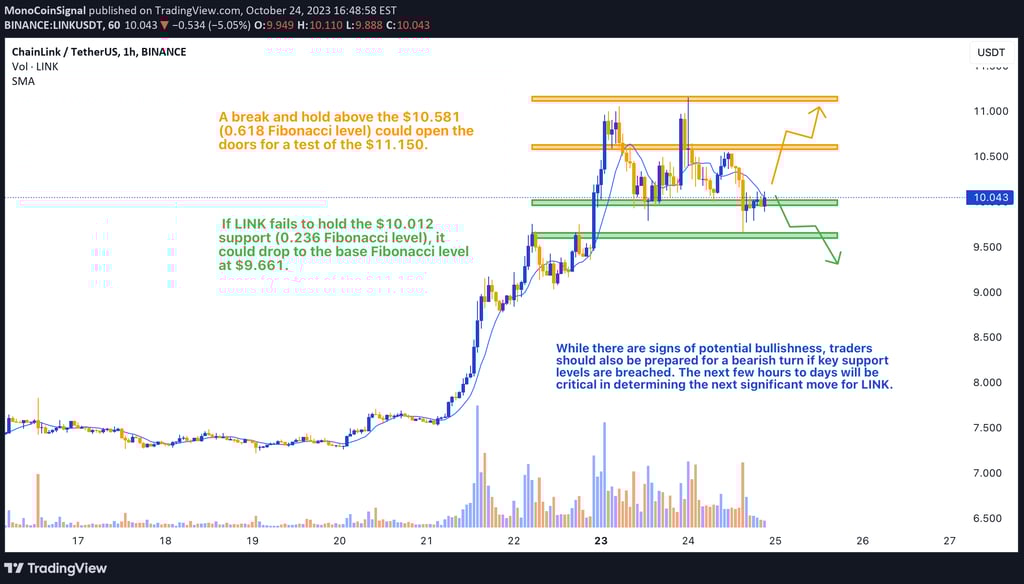
Bullish Scenario: A break and hold above the $10.581 (0.618 Fibonacci level) could open the doors for a test of the $11.150.
Bearish Scenario: If LINK fails to hold the $10.012 support (0.236 Fibonacci level), it could drop to the base Fibonacci level at $9.661.
Conclusion:
The LINK 1-hour chart presents a crucial juncture. While there are signs of potential bullishness, traders should also be prepared for a bearish turn if key support levels are breached. As always, it's essential to set appropriate stop-loss levels and not trade purely based on predictions. The next few hours to days will be critical in determining the next significant move for LINK.