Key Support and Resistance to Monitor
Ethereum shows a downward trend with key levels at $3500 and support levels to watch. RSI indicates potential buying interest, while MACD suggests cautious momentum.
3/21/20241 min read
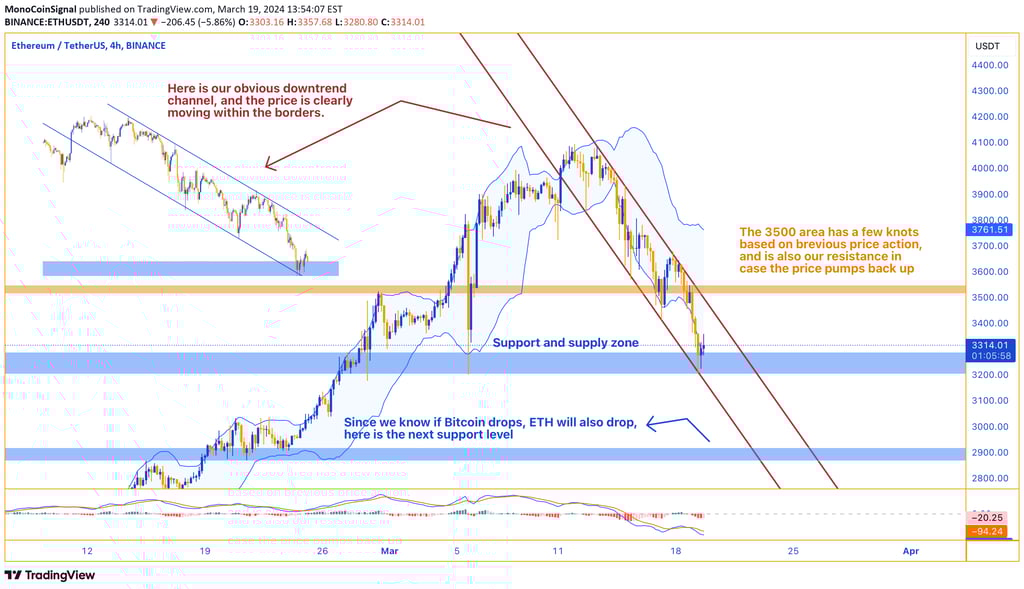
Ethereum is moving in a clear downward direction, within set upper and lower limits that have guided its price lately. The $3500 level is an important one to watch—it’s where Ethereum has struggled to rise above in the past, and it could tell us if the trend is about to change.
The market has found steady ground at a certain support level, which is a price range where Ethereum doesn’t tend to fall below. If Bitcoin’s price starts to fall, Ethereum might follow, because their prices often move together. Keep an eye on the next support level, as it could be where Ethereum’s price steadies if it does drop.
The RSI, which can signal if Ethereum is being bought or sold too much, is showing some positive signs. However, the MACD, another indicator we look at to get a sense of the market’s momentum, suggests that the cautious mood hasn’t lifted yet.