Key Fibo Support
Explore Baby Doge's current market analysis in the daily timeframe. Despite breaking its upward trend line on January 3rd, the price found support at the 0.382 Fibonacci zone, potentially signaling an upcoming upward trend. Check out the marked resistance and initial target on the chart for insights into the next potential moves.
1/13/20241 min read
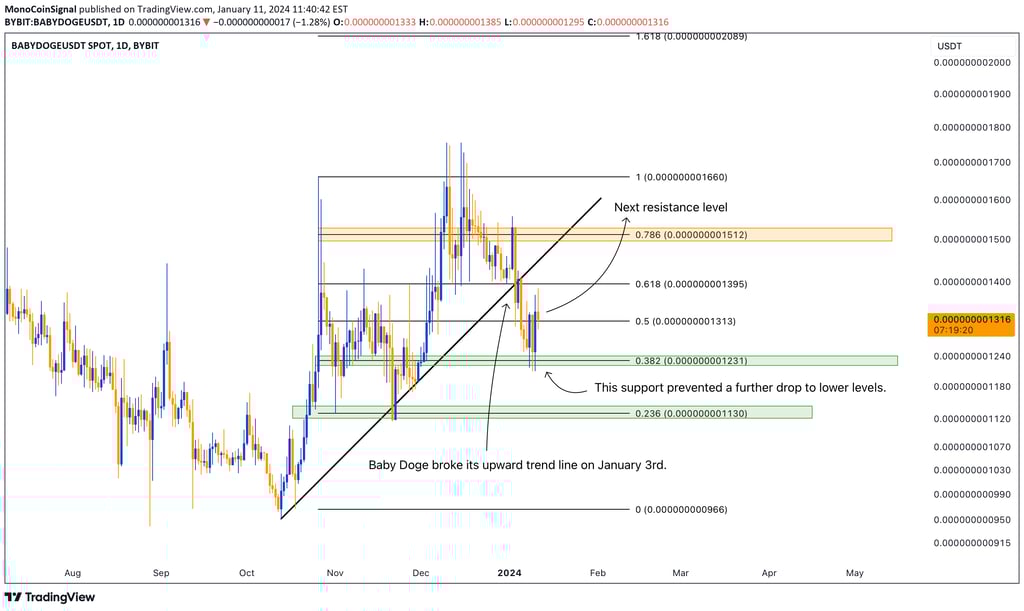
In the daily timeframe, Baby Doge, having broken its upward trend line on January 3rd, reached the 0.382 Fibonacci zone's support area, where the support prevented the price from descending to the lower support level. This support might initiate an upward price pattern for Baby Doge. The resistance and initial target are marked on the chart.