High potential support zone and a large triangle pattern
1INCH is oscillating within a large triangle pattern. With current candle formations and support, the price is expected to test the triangle's upper boundary again.
6/22/20241 min read
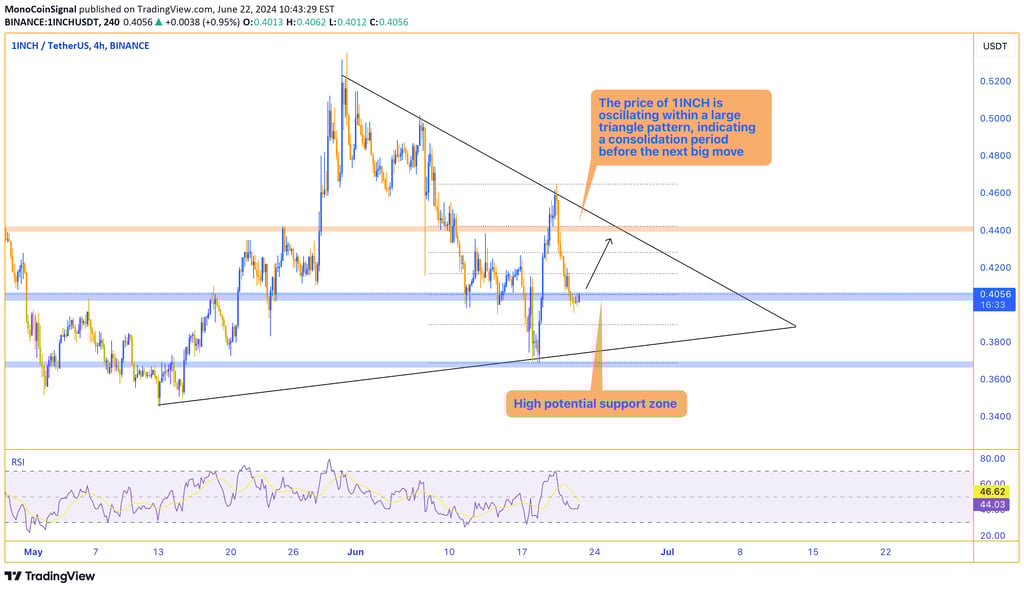
The price of 1INCH is oscillating within a large triangle pattern. Given the candle formation and the support in this range, we expect the price to test the triangle's upper boundary again.