Here is the analysis of today!
Bitcoin - Ethereum - UNI - BNB - XRP - DOT - SOL - ADA 21 Jan 2023
BITCOIN AND ALTCOINS ANALYSIS
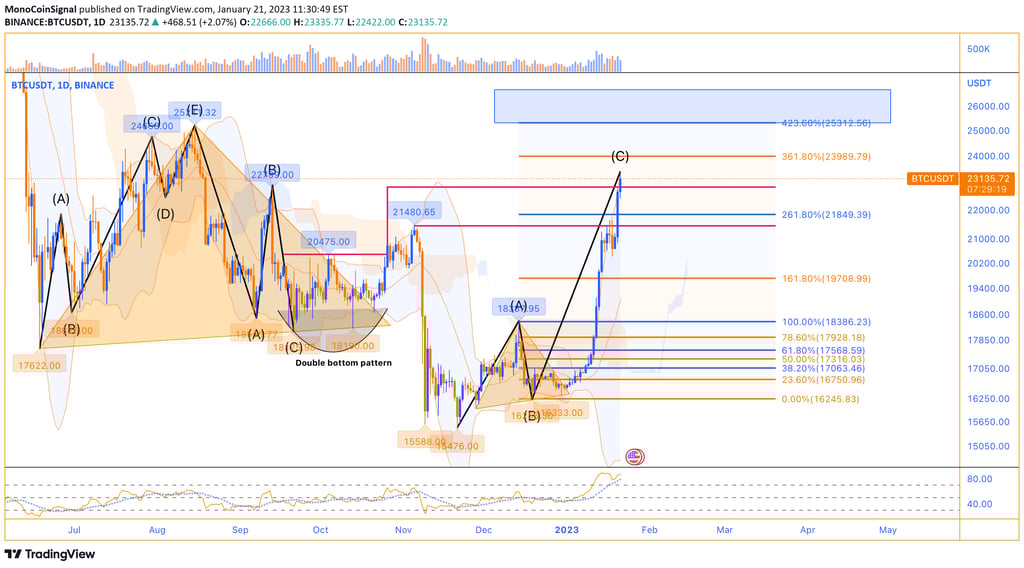
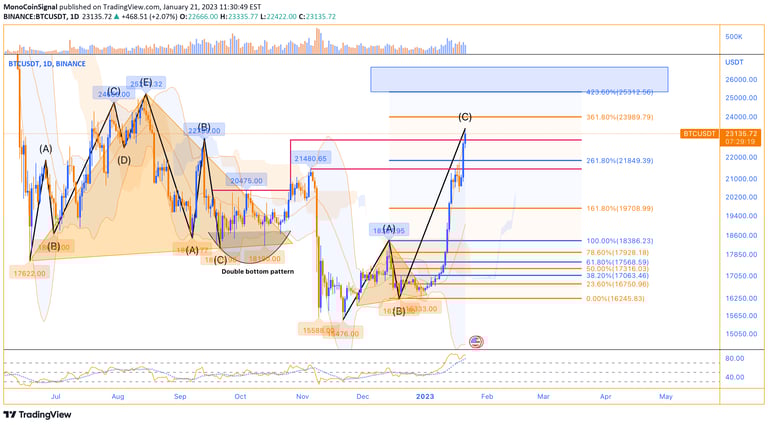
Bitcoin's strong upward movement yesterday broke the resistance at $21,480, pushing the price of Bitcoin into the $22,000 channel. We could see this positive signal on Tether's Dominance. This resistance has been accompanied by reactions, and the trend of Bitcoin can range again in the lower timeframes. In the 4-hour and daily timeframe , we can consider a narrow ascending channel for Bitcoin . As long as the bottom of the channel is not broken, Bitcoin can rise to its main resistance in the range of $25,312 to $26,700.
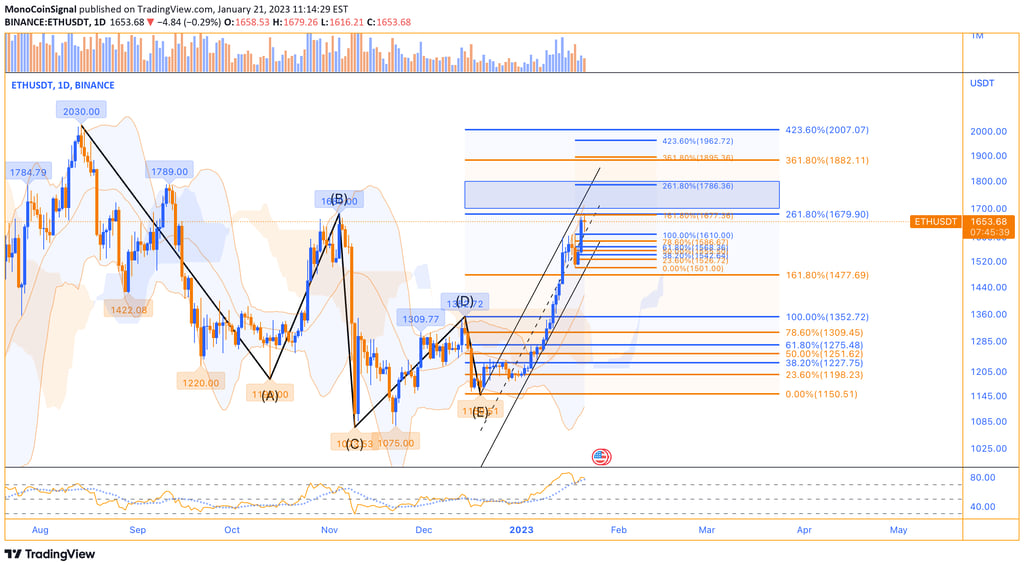
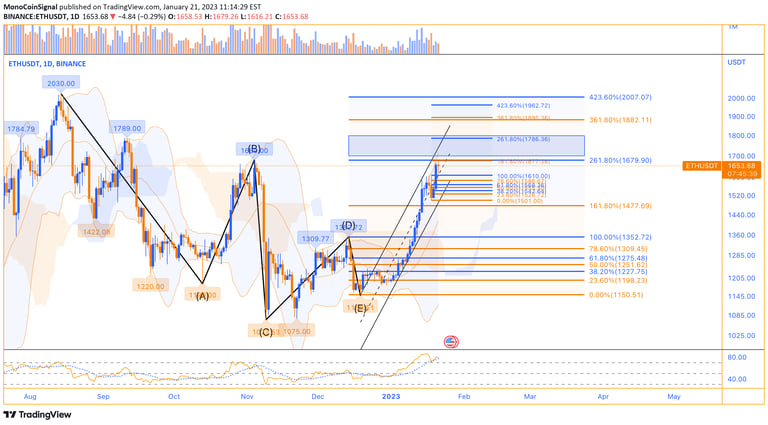
Yesterday, Ethereum broke its minor resistance in the range of $1,568 and once again broke the $1,610 resistance level . ETH's movement is within a narrow ascending channel (as you can see on the chart), with the ceiling of the channel at $1700 and $1800 being the ultimate targets for short-term buyers. We expect to see the range trend for Ethereum in these ranges. Of course, a range can be formed after the last possible upward movement of this trend.
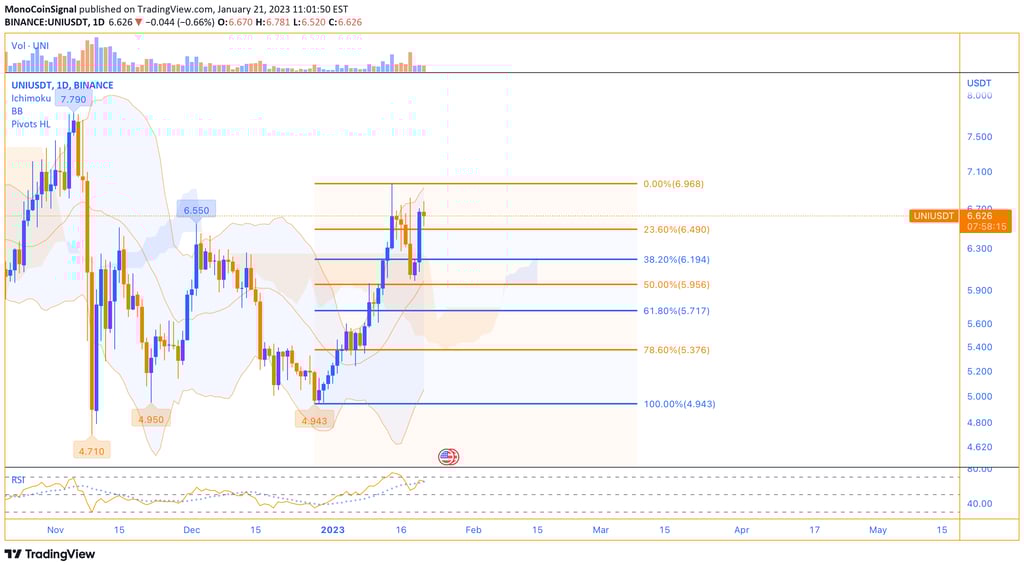
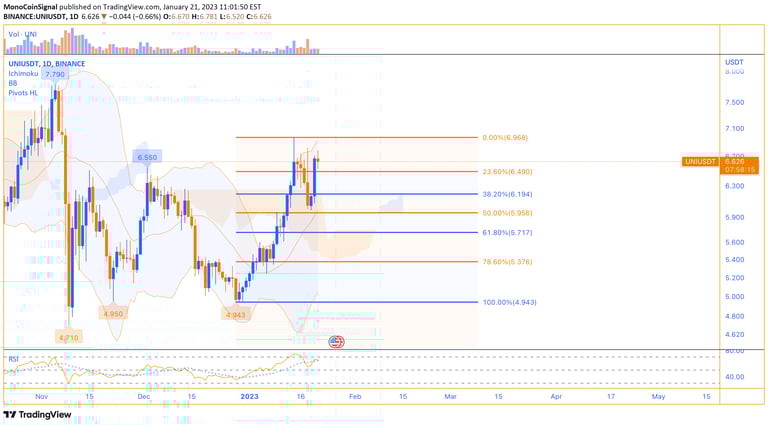
As long as the support level of $6.19 is maintained, the potential for a reversal in the daily timeframe will again be provided. The 4-hour time trend will not be bearish as long as this support is held. Due to the high strength of both ranges, the probability of the range trend continuing this week is high. If the strong candle closes above resistance without an upper shadow, the next target will be at $7.5 - $8 area.
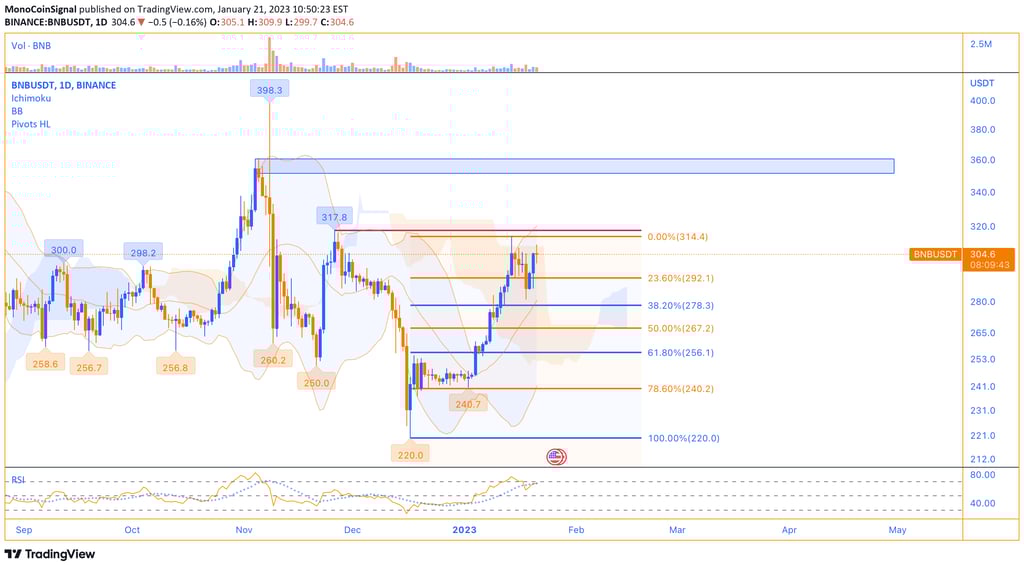

BNB, after breaking the support of the short-term uptrend line, the price hit the static support levels considered in the $282 range, and with a positive reaction to this area, the price increased again and tried to test the previous resistance break. The current resistance level is considered in the range of $317.8; if it is broken, the BNB can continue to move upward until the next target in the range of $353. Therefore, the current resistance of the short-term trend is very important. But if a negative reaction to this area is observed, and the support of the $292 range is broken again due to the range trend in the 4-hour timeframe, we can expect a test of the previous floor.

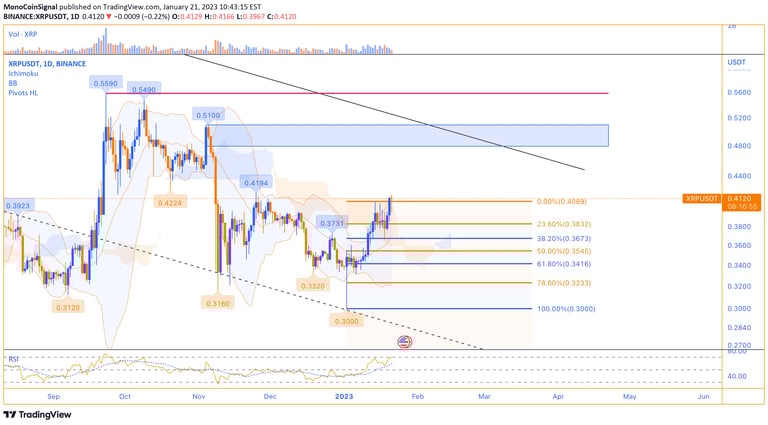
XRP has been in a range over the past week, and the 4-hour timeframe candles saw a correction to the $0.366 support area after breaking through the uptrend line support. The strong positive reaction due to the high strength of the buyers caused the previous ceiling to be tested again. The power of yesterday's candle indicates that there is a possibility of a complete breaking of the current resistance. In this case, the higher target we can consider for Ripple will be the $0.50 area. The second resistance overlaps exactly with the ceiling resistance of the descending channel and can cause a negative reaction. This area is a strong supply range; from this level, we expect a price correction to support $0.4089. The main target of medium-term buyers can also be considered in the resistance range of $0.5590.
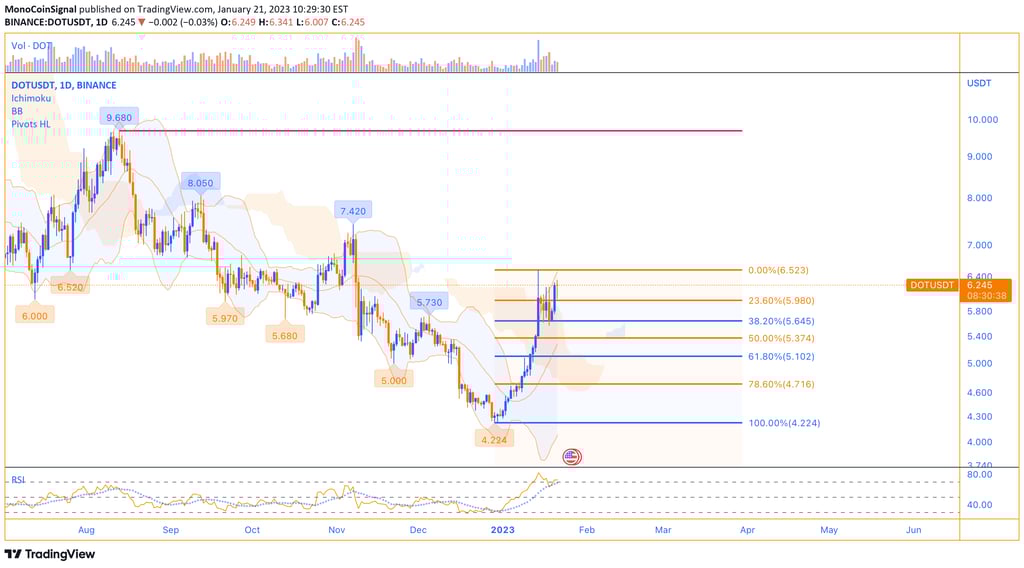

Given that the potential for an intraday trend reversal has emerged for DOT, if buyers can keep the price above $6.523, price growth could continue into the $9.680 range in the medium term. If the resistance of the ceiling of the descending channel is completely broken, it will be possible to reach the target of $9.680. Of course, pullbacks should not be ignored, and a return to the lows in the $5.102 - $5.374 range is possible. The last point is that if the previous ceiling at $6.523 is broken before the pullback, we can consider the $6.523 support as a safe zone for a pullback.
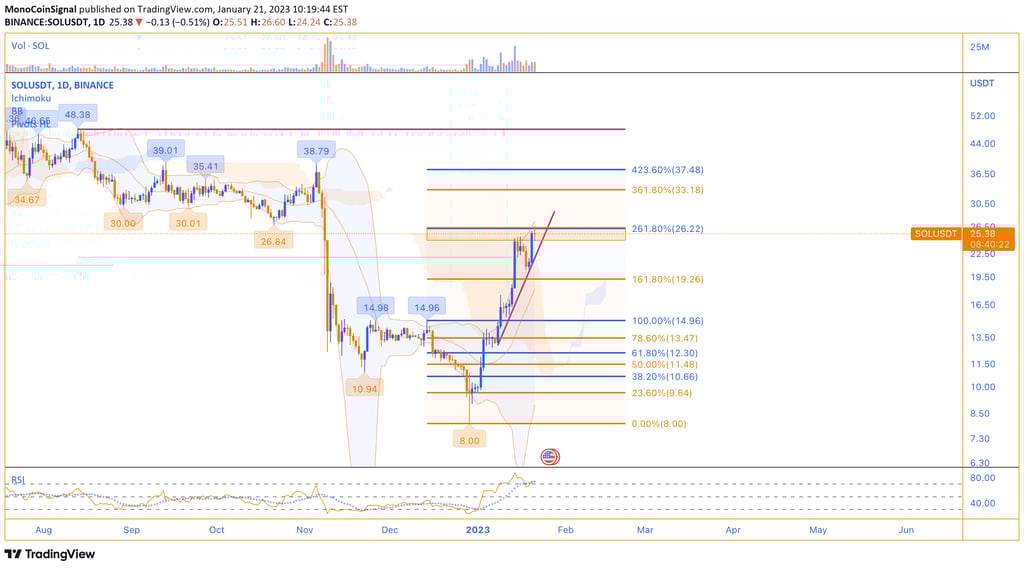
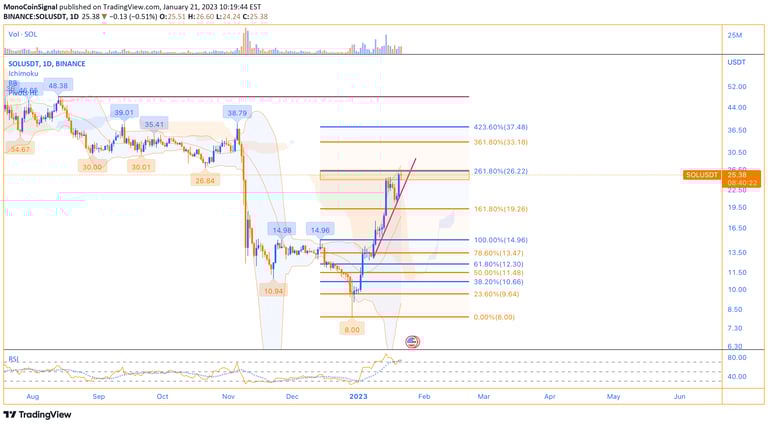
SOL entered a shallow correction over the past week after reacting to the $24.5-$26 resistance range, and the price dropped to the $20.50 range. It was again supported by the high strength of the previous bullish wave, and yesterday it recorded a strong bullish candle with a 20% increase in price. In the 4-hour period, if the strong bearish candle is not closed below the $25 range, the possibility of a complete break of the current resistance and further movement to reach the resistance ranges of $33.18 to $37.48 at the ceiling of the descending channel will be provided. This target is located exactly at the ceiling of Solana's main descending channel , but the main and important resistance from which we expect a strong negative reaction is located in the $48 range. If Solana's short-term uptrend line is broken, it can move below the current resistance range of the range trend.

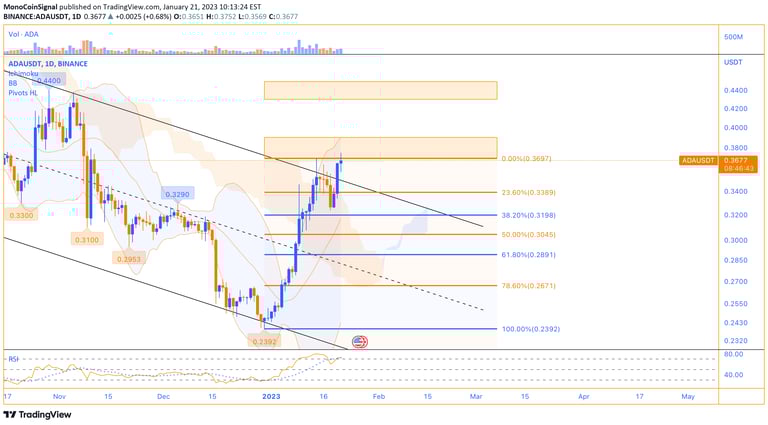
After ADA took the range trend under the ceiling resistance of the main downward channel , this resistance was broken again yesterday with the support of buyers. Cardano's next targets on the chart are the $0.3750-$0.390 resistance range and the $0.43-$0.45 range, which could be short-term buyers' profit-saving areas. We can consider an ascending channel for ADA in the 4-hour time frame. As long as the bottom of the channel is not broken, the price increase can continue up to the specified targets. In case of breaking the first specified target, the potential to change the trend in the daily timeframe will be provided.
Don't forget to check out monocoin.net for more crypto analysis and crypto signals.
You can also join our channel to receive telegram crypto signals for crypto and forex.
Join the MonoCoin Signal VIP to receive the best cryptocurrency signals and analysis.
MonoCoin Signal also provides crypto tutorial content for crypto trading for VIP users, so they can gain more profits.