GRT: Current Situation
GRT trades at $0.0930, testing key support at $0.0900 amid a market downturn. A bounce could target $0.1000, while a drop risks $0.0800. Watch volume for confirmation.
3/26/20251 min read
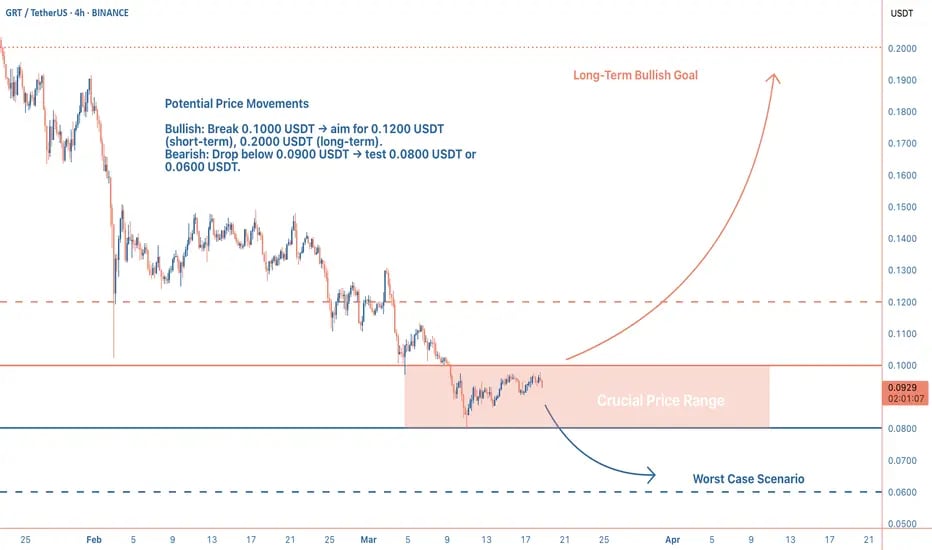
GRT is trading at 0.0930 USDT, down over 70% from its September peak of 0.3600 USDT, reflecting a steep decline amid a broader crypto market dip (total market cap down 4.4% in the last 24 hours). The price is testing a critical support zone at 0.0900-0.0930 USDT, with bearish signals dominating: it’s below the moving average, and indicators like MACD suggest ongoing selling pressure. A falling wedge pattern hints at a potential reversal, but volume is needed to confirm any breakout. The market’s cautious mood amplifies GRT’s struggles, making this a pivotal moment.
Technical Indicators and Key Levels
Short-Term (4-Hour Chart):
Support: 0.0900-0.0930 USDT (critical), 0.0800 USDT
Resistance: 0.1000 USDT, 0.1200 USDT
Indicators: RSI near oversold (~30), MACD bearish. A hold above 0.0900 USDT could spark a bounce to 0.1000 USDT.
Long-Term (One-Year Chart):
Support: 0.0800 USDT, 0.0600 USDT
Resistance: 0.2000 USDT, 0.3000 USDT
Holding 0.0900 USDT is key for any recovery; below risks a deeper slide.
Potential Scenarios
Bullish Case: Hold 0.0900 USDT, break 0.1000 USDT with volume → target 0.1200 USDT (short-term), 0.2000 USDT (long-term).
Bearish Case: Break below 0.0900 USDT → test 0.0800 USDT or 0.0600 USDT.
Volume is critical—watch for spikes to confirm moves.
Broader Context and Tips
GRT’s role in decentralized indexing supports long-term value, but short-term risks loom. Traders should focus on 0.0900 USDT, a hold could signal a bounce, a break risks more downside. Use tight stops (e.g., below 0.0900 USDT for longs) and stay alert for volume shifts or news on adoption. Long-term, accumulating near 0.0900 USDT or 0.0800 USDT could pay off if the market turns.