FUN: Evaluating Current Market Conditions
Explore a thorough analysis of FunFair (FUN) based on crucial technical indicators and price patterns. Uncover insights into potential short-term consolidations and the asset's medium to long-term bullish outlook to navigate your investment strategies effectively.
10/19/20231 min read
The charts provided offer a glimpse into the current market behavior of the FunFair (FUN) token. Through a detailed examination of various technical indicators and price patterns, this analysis aims to forecast potential future price movements and key levels of interest.
Analysis:
Bollinger Bands (BB):
The price seems to be oscillating around the middle of the bands. If it approaches the upper band, it may indicate an overbought condition, and if it nears the lower band, it might be in an oversold condition.
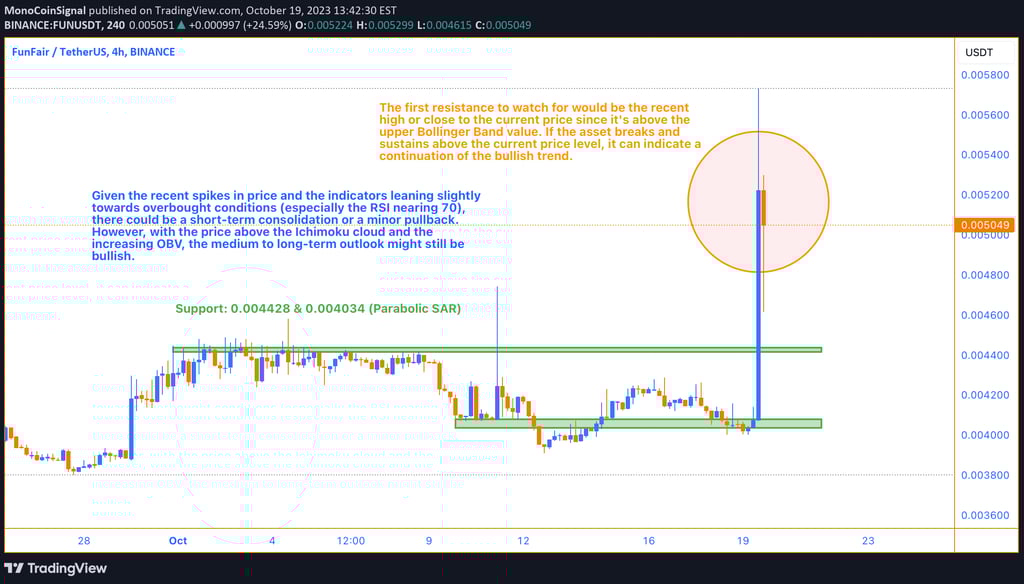
Parabolic SAR: The current SAR value is 0.004034. If the price remains above the SAR, it indicates a bullish trend, and if below, a bearish trend.
Ichimoku Cloud: The price is currently outside and above the cloud, which is typically a bullish sign.
Volume Oscillator (Plot): At 61.49%, the increased volume can indicate heightened interest in the asset, possibly signaling a continuation or reversal of the current trend.
Stochastic Oscillator:
When the %K crosses above the %D, it's a buy signal and vice-versa. They're currently almost equal, indicating indecision.
Relative Strength Index (RSI): The RSI stands at 69.24, which is near the overbought territory (above 70). This might suggest a potential pullback or consolidation in the near future.
OnBalanceVolume (OBV): 23.442B. A rising OBV indicates that volume is increasing on upward price moves, which can be a bullish sign.
Probable Scenario:
Given the recent spikes in price and the indicators leaning slightly towards overbought conditions (especially the RSI nearing 70), there could be a short-term consolidation or a minor pullback. However, with the price above the Ichimoku cloud and the increasing OBV, the medium to long-term outlook might still be bullish.
Conclusion:
While the short-term scenario might see some consolidation due to overbought indicators, the overall trend seems to be bullish for FunFair (FUN). Investors should keep an eye on the key price levels mentioned and make decisions based on their risk tolerance and investment goals.